The District has always been home to a large contingent of transplants. Some of these new residents never leave, while others remain here for only a short period of time. D.C.-born residents have never accounted for a large majority of the city’s population, but the past decade of sharp population growth has altered many of the city’s neighborhoods. This article explores where current D.C. residents were born, where D.C.-born residents live today, and how the share of D.C.-born residents has changed in different parts of the city since 2010.
Which areas of the city currently have the highest concentrations of adults who were born in D.C.
After a steady increase in population after the Civil War, D.C. saw several large shifts in its population during the twentieth century due to factors such as the Great Migration, wartime government employment, white flight and suburbanization, and the arrival of new immigrant communities.[1] Throughout these ebbs and flows, the share of adult D.C. residents who were born in D.C. has remained between roughly 20 to 32 percent, according to Census data.[2]
In 1910, around one in three D.C. residents had been born in the District, but at the peak of the city’s population boom in 1950 and 1960, only one in five residents had been born in D.C. More recently, in both the 1990 and 2000 censuses, D.C.-born residents made up about 31 percent of the adult population. Estimates from the most recent American Community Survey suggest this share was around 28.6 percent for the five-year period between 2013 and 2017, or about 37 percent for all residents, including children.
Part of the recent decline in the relative presence of D.C.-born residents is the result of continued migration from other parts of the country. Earlier this year, D.C. planning officials calculated the population had exceeded 700,000, marking a gain of roughly 100,000 residents since 2010. The slightly lower share of D.C.-born residents is also a consequence of longtime, typically poorer residents being displaced.
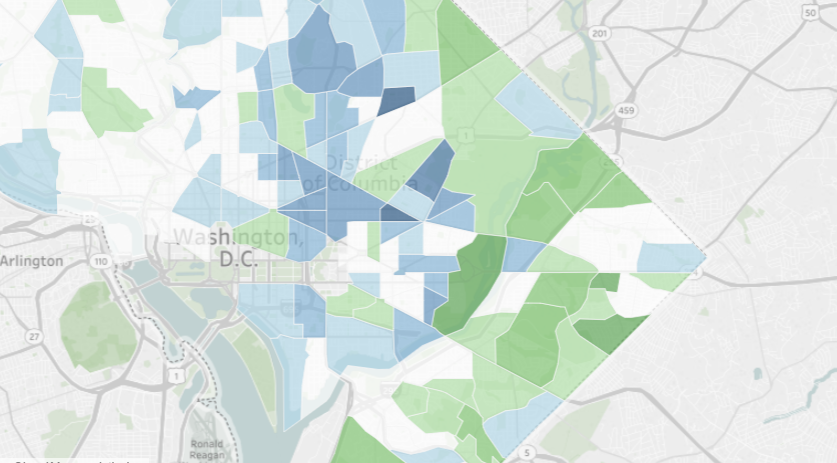
Calculations of the latest Census Bureau data suggest that just about all neighborhoods where D.C.-born residents remain most prevalent are found east of the Anacostia River. While a large concentration of predominately African American D.C.-born residents has long resided there, the recent growth has resulted in an even starker divide when compared with the rest of the District.
For a current snapshot of D.C residents with deep roots who grew up here, we reviewed place of birth estimates from the Census Bureau’s 2016 American Community Survey, calculating census tract-level estimates for adults ages 18 and older reporting they were born in D.C.
The share of D.C.-born adults in each area ranges from close to zero for census tracts in Foggy Bottom and West End to almost 80 percent in many tracts in Wards 7 and 8, although these percentages are not exact due to larger margins of error from the relatively small sample sizes involved. These stark differences reflect a range of factors, such as housing and proximity to employment centers, that are deeply tied into historical patterns of land use and residential segregation.
As the map above illustrates, at least three-quarters of adults in several Southeast neighborhoods were born in the District. A similarly-large concentration of homegrown residents can be found further north in Parkside and Kenilworth, a neighborhood the Washington Post described in 2016 as being on “the brink of gentrification.” By comparison, longtime residents who were born in D.C. are relatively scarce throughout much of the rest of the District, making up just over 28 percent of adults. They’re particularly uncommon in many Northwest neighborhoods, often making up less than a tenth of the population.
Which neighborhoods have seen a change in the share of D.C.-born residents since 2010
This steady influx of new residents from other parts of the country has reshaped the makeup of many neighborhoods. For a look at how the growth has played out across individual neighborhoods, we compared tract-level estimates from the 2006-2010 American Community Survey with data for 2016. Several neighborhoods, mostly in Northeast D.C., experienced noticeable drops in shares of D.C.-born residents. (Tract-level estimates are subject to high margins of error, so differences shown might not necessarily reflect exact population shifts, particularly if they’re fairly small.)
Many of these areas with dwindling numbers of longtime residents have experienced varying degrees of gentrification. One area of the District that’s experienced among the steepest losses in D.C.-born residents recently includes Trinidad and a nearby section of the H Street Corridor. It’s an area where significant commercial investment from developers and renovations of older homes are attracting a steady stream of new residents. Selling prices for several Trinidad homes have recently topped $900,000, an unheard of price for the neighborhood not long ago.
Where D.C. transplants were born
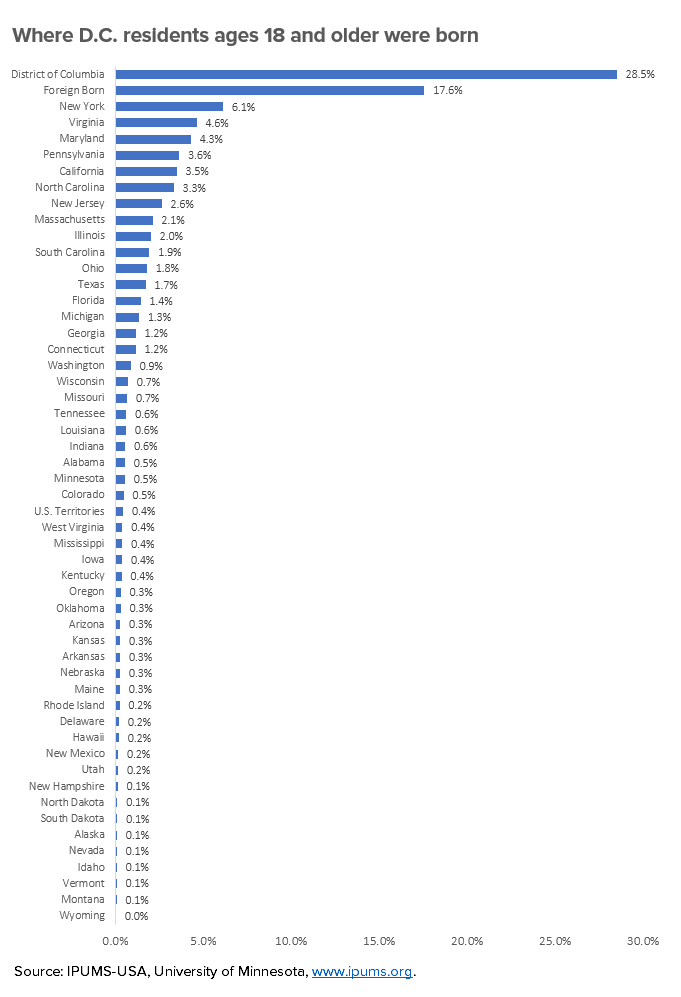
Finally, it’s worth examining where all the rest of D.C. residents are from originally. Although migration data not presented here shows where they recently moved from, we’ll again refer to the same Census dataset indicating their place of birth. As one would expect, the District’s population reflects a broad cross-section of the country.
Roughly 18 percent of D.C. adults were born abroad—a percentage that’s not much lower than that of those born in the District. Within the U.S., the state with the single highest tally of native residents is New York, accounting for about 6 percent of D.C. adults. While one might assume many longtime D.C. residents were born in Maryland or Virginia hospitals, the Census estimates suggest they each accounted for only slightly more than 4 percent of the District’s adults.
The composition of D.C.’s population has changed over time, as this interactive graphic from the New York Times shows: People born in Virginia and Maryland used to make up a larger share of D.C.’s population, particularly in the first half of the twentieth century, but the birthplaces of D.C.’s population have become more varied in recent decades. (Note: Unlike the maps in this article, which show data for adults ages 18 and older, the New York Times interactive displays data for all residents, including children and youth ages 0-17.)
Where do D.C.-born residents go?
The proportion of D.C. residents who were born in D.C. can decline in relative terms when large numbers of people moved into D.C. from elsewhere. But it can also decline in absolute terms when D.C.-born residents leave the District.
In the first decades of the twentieth century, the New York Times interactive shows, the vast majority of people born in the District lived in the District, although this share declined over the years. In 1900, 79 percent of people born in the District (of all ages) lived in the District, but by 2012, only 17 percent of people born in the District lived in the District. Maryland has consistently been the most common destination for D.C.-born residents, and the share of people born in D.C. who live in Maryland grew steadily until 1990, when 37 percent of people born in D.C. lived in Maryland.
Even as other jurisdictions in the region experienced outmigration in recent years, the District’s net domestic migration remains positive. In general, D.C. residents (regardless of birthplace) often move within the metro region, as Kate Rabinowitz has shown, with Prince George’s County still the top destination for people moving out of D.C.
About the Data
Data represent numbers of adults age 18 and over who reported they were born in the District. Estimates were calculated from 2012-2016 and 2006-2010 Census Bureau American Community Survey estimates. Tract level data is subject to high margins of error, particularly for neighborhoods with fewer residents. Additionally, residents are categorized as native D.C. residents only if they were born in the District of Columbia, which may not include many longtime residents who grew up in the District or otherwise consider themselves “native Washingtonians,” despite being born elsewhere.
As noted previously, the share of D.C. adults who were born in D.C. has remained between roughly 20 to 32 percent, but changes in how the birthplace question was asked make it difficult to compare exact percentages prior to 1990. According to IPUMS documentation:
Prior to 1900, the census provided no explicit instructions to enumerators other than to report the state or territory in which the person was born. From 1900 onwards, native-born Americans were to follow contemporary boundaries when reporting the state, territory, or U.S. possession in which they were born.
The 1950 enumerator instructions and the 1960, 1970, and 1980 census forms further instructed respondents to give their state (or country) of birth as the state (or country) in which their mother resided when they were born, even if their mother went to a hospital in another state (or country) to give birth. This instruction was dropped in 1990, when evaluations by the Census Bureau showed that many respondents either ignored or misunderstood it. ()
The following table shows how the proportion of D.C.-born residents among D.C.’s adult population has changed since 1900, based on available data sets.
| Dataset | Year | Percentage of adult D.C. residents (ages 18+) who were born in D.C. |
| 2013-2017 American Community Survey | 2017 | 28.6 |
| 2006-2010 American Community Survey | 2010 | 30.2 |
| 2000 Census 5% Sample | 2000 | 30.7 |
| 1990 Census 5% Sample | 1990 | 31.1 |
| 1980 Census 5% Sample | 1980* | 28.0 |
| 1970 Census 1% Sample Form 1 | 1970* | 29.3 |
| 1960 Census 5% Sample | 1960* | 19.9 |
| 1950 Census 1% Sample | 1950* | 19.5 |
| 1940 Census 1% Sample | 1940 | 22.4 |
| 1930 Census 5% Sample | 1930 | 25.9 |
| 1920 Census 1% Sample | 1920 | 23.6 |
| 1910 Census 1% Sample | 1910 | 31.6 |
| 1900 Census 5% Sample | 1900 | 28.7 |
| * Indicates changes in question wording related to mother’s place of residence. | ||
Estimates for the proportion of residents born in other states were derived from microdata from IPUMS-USA, University of Minnesota, www.ipums.org.
Notes
[1] See also Chocolate City, chapter 9, and The Color of Wealth in the Nation’s Capital, p.21 and pp. 29-30.
[2] Since 1970, the share of D.C.-born residents has remained roughly around 30 percent, although changes to how the Census Bureau asked this question has made it difficult to compare exact numbers before and after 1990. According to IPUMS documentation, the 1950 enumerator instructions and 1960-1980 census forms instructed respondents to respond by stating their where their mother resided when they were born, even if she gave birth at a hospital in another state. This instruction was ended in 1990.
D.C. Policy Center Fellow Mike Maciag crunches numbers and writes for Governing magazine on a variety of policy issues relating to state and local governments. He holds a master’s degree in public administration from George Mason University and undergraduate degrees in journalism and computer science from the University of Dayton. Follow him on Twitter at @mikemaciag.