

State of D.C. Schools is an annual systemwide overview of public education in the District of Columbia. In school year 2023-24, D.C. showed strong system health with increased public school enrollment and improvement in educator retention. This report looks at the role of school in the lives of D.C. stakeholders, with a focus on learning outcomes, attendance challenges, and more. This version of the report has been adapted for web. You may also access the original PDF version.
Quick links
- Read this report in its original PDF format
- Report one pager / En español
- Interactive summary of key results
- Launch event information
About the D.C. Policy Center
The mission of the D.C. Policy Center is to arm decision makers with fact-based, unbiased, and reliable research and analyses to help create a vibrant local economy that can maximize opportunities for residents, workers, and businesses in the District of Columbia. Through objective and rigorous research and collaboration, the D.C. Policy Center develops and tests policy ideas, disseminates its findings, actively promotes policy solutions, and engages in constructive dialogue and debate.
About this report
State of D.C. Schools is an annual systemwide overview of public education in the District of Columbia. The report’s main purpose is to give D.C. residents, parents, caregivers, policymakers, and other stakeholders a snapshot of the overall performance of the District’s public schools.
This report captures school year 2023-24 and examines the role of school in stakeholders’ lives, academic outcomes for students, and a continued push towards improving attendance.
We hope that this State of D.C. Schools report will help inform local education leaders and policymakers in their development of future policy decisions, especially as improvements to learning outcomes are slowing.
The views expressed in this report are those of D.C. Policy Center researchers and experts and should not be attributed to members of the D.C. Policy Center’s Board of Directors or its funders.
Other reports in this series
Acknowledgements
This report was prepared with generous support from Education Forward DC. The report also benefited from comments provided by staff at the Office of the Deputy Mayor for Education, the Office of the State Superintendent of Education, and Education Forward DC. Their review in no way indicates an endorsement of this report, and all errors are the responsibility of the D.C. Policy Center authors.
Introduction
School year 2023-24 continued the work of recovery from the pandemic in D.C.’s public schools (including District of Columbia Public Schools, or DCPS, and public charter schools), including how the role of school has changed post-pandemic. A push to decrease high chronic absenteeism rates and improve learning outcomes was at the center of these recovery efforts.
Outcomes for school year 2023-24 show some signs of strong system health. Public school enrollment is on the rise, at a time when it is decreasing across the country. However, academic recovery has been slow across student groups and grade bands, similar to results on national assessments. Additionally, while chronic absenteeism has improved, it is still much higher than in pre-pandemic school years, following national trends. Key metrics indicate that the pandemic’s effects on education are enduring and will require years to reverse—in D.C. and nationally.
This State of D.C. Schools, 2023-24 report presents a landscape of outcomes for D.C.’s public schools in this context.
Executive Summary
School year 2023-24 marked the third year of in-person learning in D.C.’s public schools since the pandemic began. In the years since March of 2020, the role of school has fluctuated, first contracting to virtual learning with a larger role for parents and caregivers, and then often expanding during recovery years, with new mental health and wraparound supports, for example, and a large influx of federal funding.
This expanded role of school has been accompanied by modest improvements in the past year to chronic absenteeism and learning outcomes, which both worsened after the pandemic. Progress has also been slow in other metrics, including college and career readiness outcomes and discipline. At the same time, indicators of system health are strong—public school enrollment is up, and more educators and school leaders are staying in their roles.
There are great demands on schools that include academics and much more: In listening sessions, students talked about wanting schools to prepare them for the future, while teachers and parents called for a focus on academics as well as mental health support. As schools pivot to better serve students moving forward, one piece to consider is the role of school in not just academic success but also mental health support, safety, and other areas—where schools should focus with the resources they are provided and how others can step in to fill the gap.
Key findings are below, followed by the full report.
Key findings
Signs of strong system health
Enrollment grew, and student demographics were mostly stable.
- Total enrollment increased by 2.3 percent in pre-kindergarten (PK) through grade 12 to 90,608 students.
- 63 percent of students identified as Black, 19 percent as Latino, 14 percent as white, and 5 percent as other races or ethnicities, representing little change.
- 17 percent of students were students with disabilities, and 13 percent were English learners, which were similar shares to the previous year.
- 49 percent of students were designated as “at-risk”, a decrease of 3 percentage points.
Educator and school leader retention improved.
- The share of teachers who remained in the same role at the same school increased to 74 percent (up 4 percentage points).
- In addition, 9 percent of the teachers moved to another public school in D.C., indicating that 83 percent of teachers stayed in D.C. (up 3 percentage points).
- Out of all principals, 78 percent stayed at their school (up 4 percentage points).
Modest or limited progress in key student outcomes
There were small gains in learning outcomes.
- 34 percent students met or exceeded expectations in English Language Arts (ELA) (improvement of less than 1 percentage point).
- 23 percent met or exceeded expectations in math (up by 1 percentage point).
- Learning outcomes in both subjects are still lower than pre-pandemic, by 3 percentage points in ELA and 8 percentage points in math.
Progress for some other outcomes of college and career readiness has slowed.
- A smaller share of students enrolled in advanced coursework (63 percent instead of 67 percent) by the time they were in grade 12.
- However, a larger share of students in all high school grades who took AP or IB exams passed them (51 percent, up from 45 percent).
- 20 percent of students met the SAT college readiness benchmarks, the same as the previous year.
- Postsecondary enrollment within six months of graduation increased by 3 percentage points to 56 percent.
There were modest improvements in absenteeism and truancy.
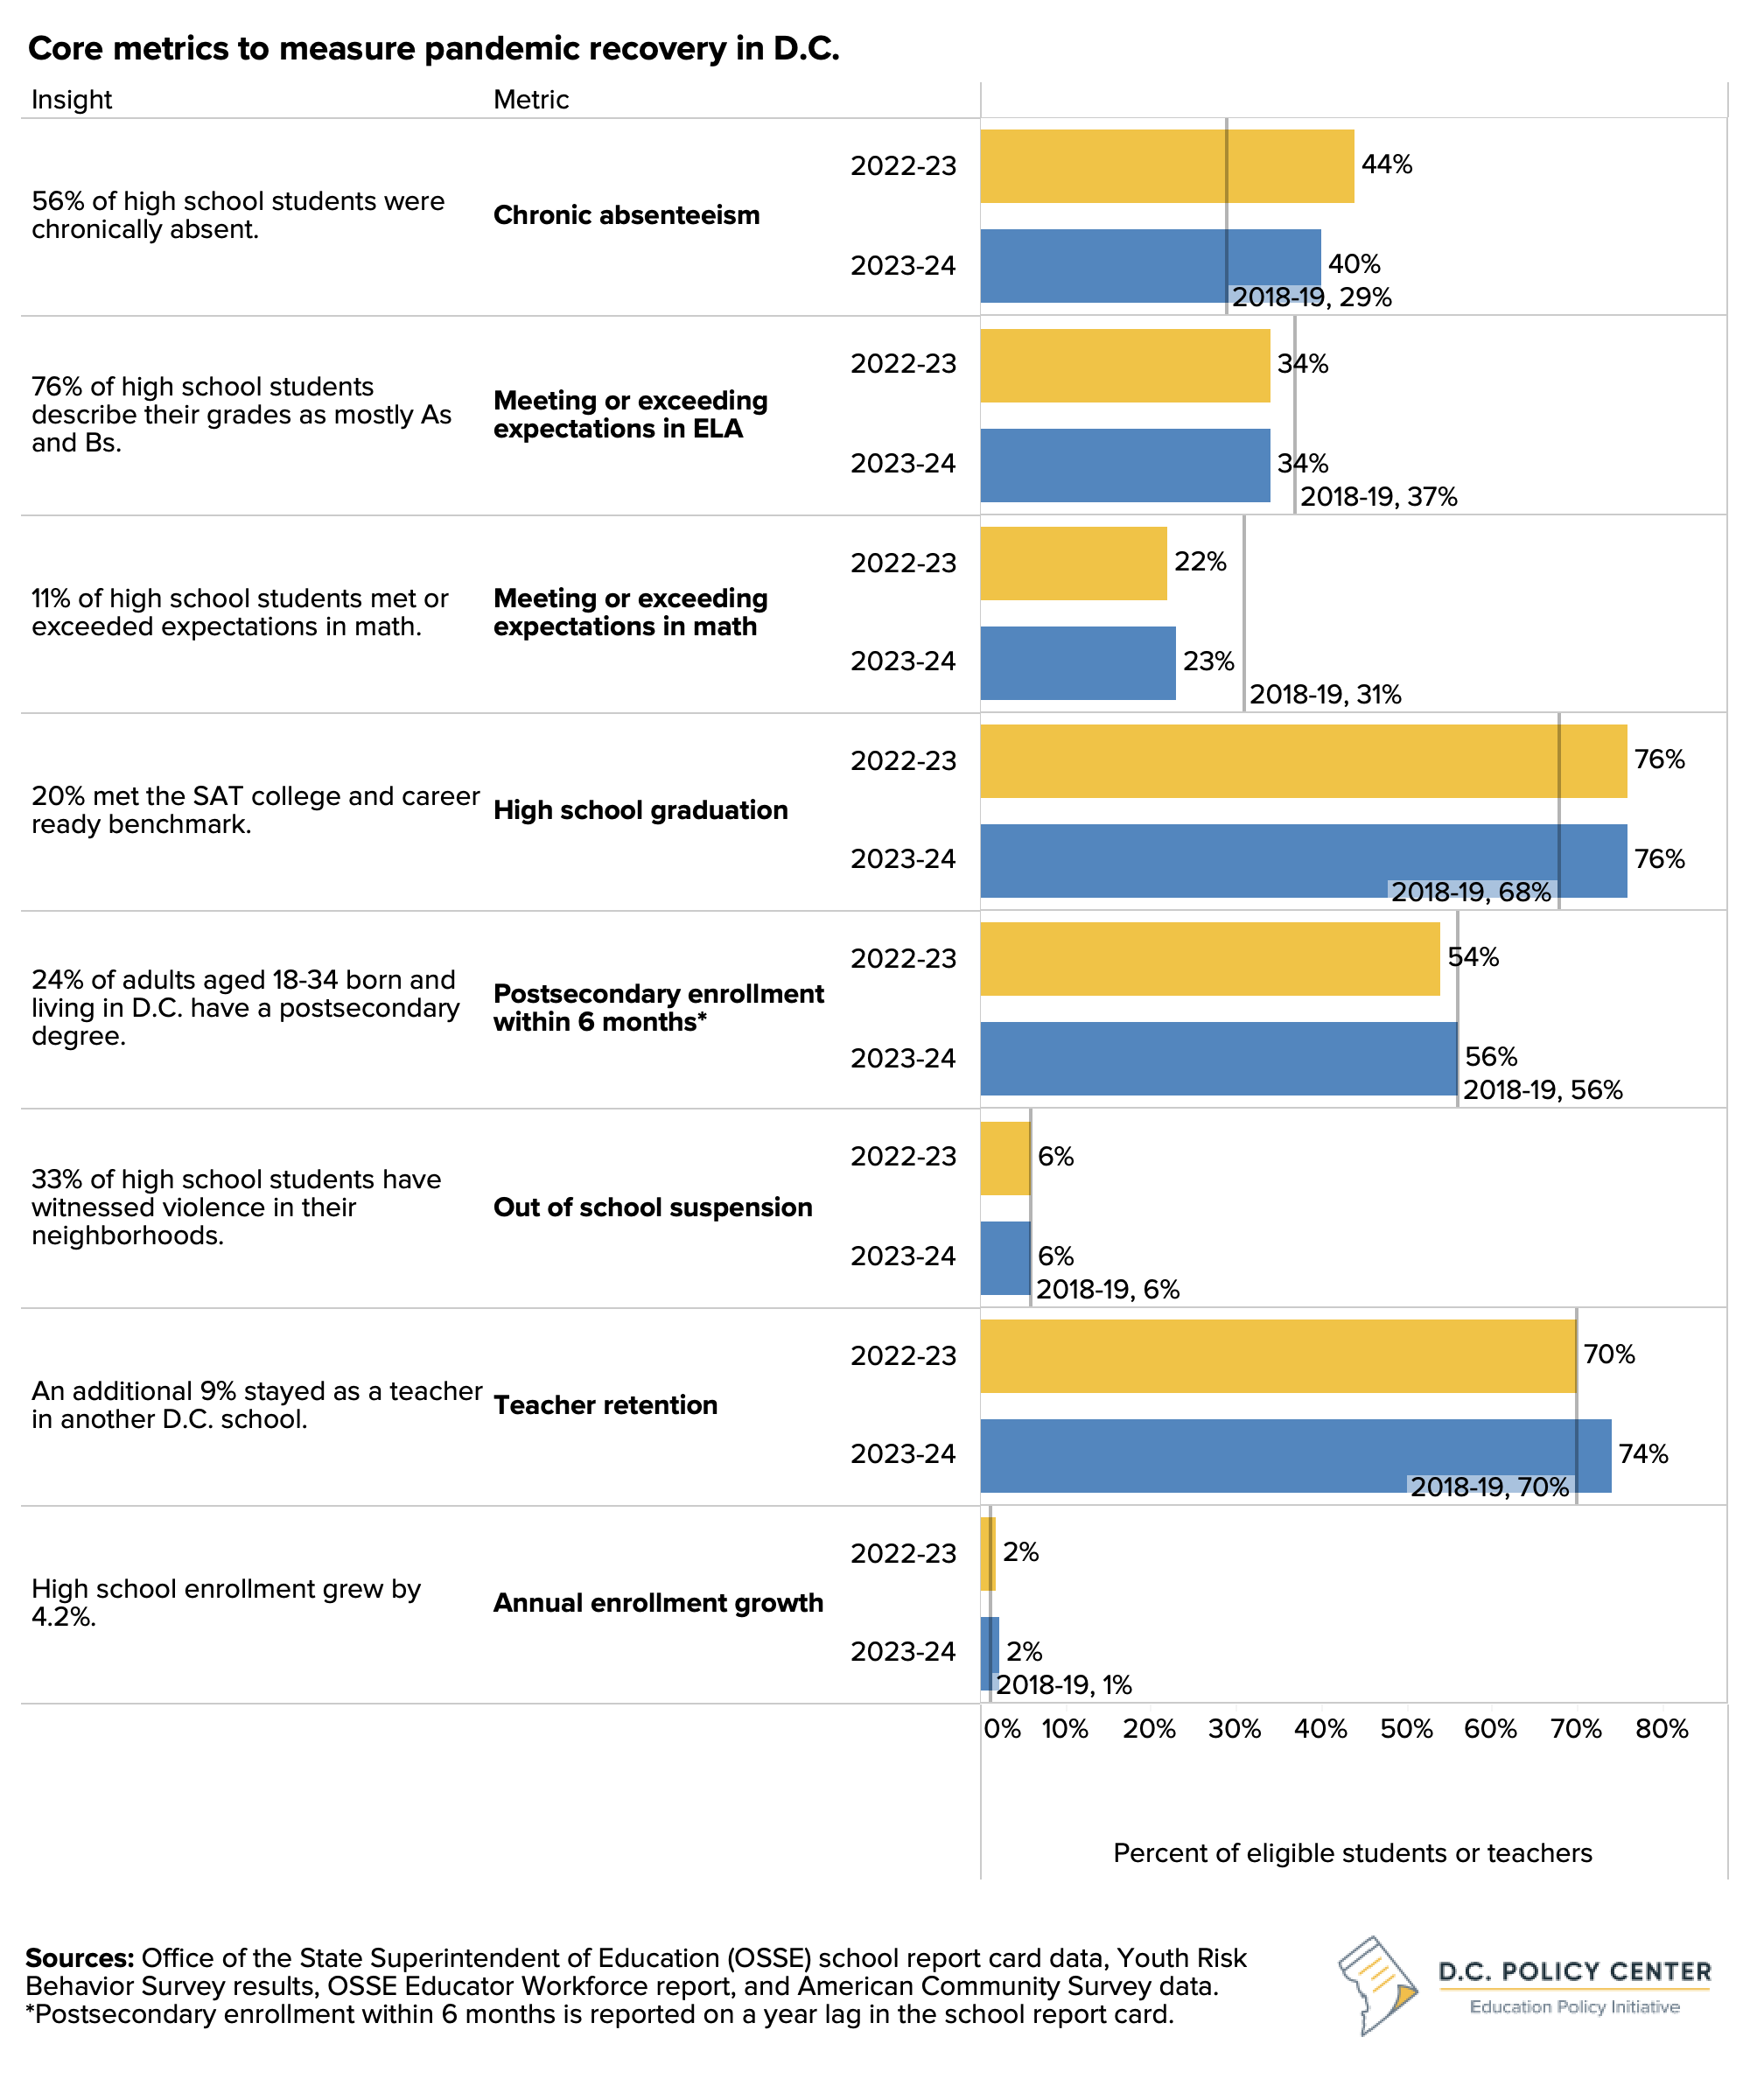
- 40 percent of students were chronically absent, 4 percentage points lower than the previous year but 11 percentage points higher than pre-pandemic.1
- At this pace, D.C. will need to improve chronic absenteeism by a little more than 5 percentage points a year to meet its goal of halving chronic absenteeism by school year 2026-27.
- 30 percent of students were chronically truant, a decrease of 7 percentage points from the previous year.
There were no changes in graduation and suspension rates.
- Graduation rates remained steady at 76 percent for the 4-year cohort.
- 6 percent of students were suspended out-of-school at least once, the same as pre-pandemic.
Taking stock
The role of school has evolved.
- After contracting in some ways during the pandemic when families stepped in to support virtual learning, the role of school has changed to be more expansive.
- In addition to learning and preparing for the future, schools are viewed as responsible for socio-emotional learning, mental health, safety, and other non-academic supports.
Moving forward
School year 2023-24 showed strong signals of system health but modest progress in outcomes at a time when there is an urgent demand for large improvements to get D.C.’s students back on track to pre-pandemic levels and beyond to prepare them for their futures. Although some recovery efforts may take multiple years to show results, there is a need to assess recovery strategies, including the role of school, and target how schools can move the needle.
Data source overview
The D.C. Policy Center relies on publicly available information to inform this report, especially the Office of the State Superintendent (OSSE)’s school report card data and enrollment audit. To complement this data with qualitative information, the research team hosted 7 listening sessions for 65 teachers, students, and parents/caregivers (including one conducted in Spanish) to hear their perspectives on school year 2023-24. Most participants were Black (56 percent), and 64 percent of English-speaking participants attended, worked, or sent their children to schools in Wards 7 and 8. The listening sessions focused on highlights and challenges in school year 2023-24, especially around attendance, the role of school, life after high school, and academic achievement. The research team also interviewed 7 school leaders at District of Columbia Public Schools (DCPS) and public charter schools with the largest improvements to chronic absenteeism while serving higher than the city’s average of at-risk students. School leaders discussed what led to attendance growth, how attendance impacts achievement, achievement trends at schools, and postsecondary connections at their schools.
Students
This section presents enrollment trends and outcomes for students.
Enrollment grew over the previous year
There were 90,608 pre-kindergarten through grade 12 students in D.C.’s public schools in school year 2023-24, an increase of 2,080 students (2 percent) from the previous year (see Figure 1).2 This is the strongest enrollment growth since pre-pandemic and goes against national and regional trends. Across the country, total public school enrollment decreased by 0.2 percent,3 and enrollment in neighboring states of Maryland and Virginia changed by less than 1 percentage point.4
Within D.C., enrollment grew the fastest in Wards 5 and 6
Within D.C., enrollment grew fastest for students living in Wards 5 and 6, by 5 percent or more. In Wards 7 and 8, on the other hand, where the highest numbers of public-school students live, enrollment decreased, especially in elementary and middle school grades.
By grade band, pre-kindergarten enrollment grew the fastest in Ward 3 by 9 percent, where a new school opened, and enrollment was low to start. For elementary school grades, Ward 5 grew the fastest by 7 percent, and Ward 6 grew the fastest for middle school grades by 11 percent. In high school, enrollment grew the fastest by 8 percent in Ward 2—similar to Ward 3 for pre-kindergarten, a new high school opened nearby, and enrollment numbers were low to start.
There was little change in special student populations
In school year 2023-24, 49 percent of students were designated as “at-risk” if they met one or more of the following criteria: experiencing homelessness, being in the District’s foster care system, qualifying for Temporary Assistance for Needy Families (TANF) program or the Supplemental Nutrition Assistance Program (SNAP), or being overage in high school. This represents a decrease of 3 percentage points from the previous year (see Figure 3) but is still higher than pre-pandemic (45 percent in school year 2018-19). The share of special education students increased by 1 percentage point to 17 percent, and the share of English learners remained the same at 13 percent.5
Race and ethnicity remained stable
Across all grades, 63 percent of students were Black (1 percentage point decrease from the previous year), 19 percent were Latino (1 percentage point increase), 14 percent were white (no change from the previous year), and 5 percent were other races or ethnicities (including two or more races, Asian, Native Hawaiian or other Pacific Islander) in school year 2023-24 (see Figure 4).6 In general, the share of students who are Black and Latino increases as students grow older, and the share of students who are white decreases (representing 18 percent of pre-kindergarten enrollment compared to 8 percent of high school).
Enrollment by sector showed an increase in DCPS enrollment
D.C. has a lot of public school choice, meaning students and families can choose whether to attend their by-right school or to attend elsewhere. In school year 2023-24, 45 percent of pre-kindergarten through grade 12 students were enrolled in a public charter school, a 1 percentage point decrease from the previous year.7 The remaining 55 percent enrolled in District of Columbia Public Schools (DCPS) schools. 28 percent attended their by-right school, based on their residence. 20 percent attended a DCPS school as an out-of-boundary student, 5 percent attended a DCPS application high school, and 2 percent attended a DCPS alternative or citywide school (see Figure 5).
In addition to public school enrollment, 941 students were homeschooled in school year 2023-24, a decrease of 4 percent from the previous year.8 An estimated 17,225 students attended private and parochial schools in school year 2023-24, a decrease of 3 percent.9
Modest progress in learning outcomes
In school year 2023-24, D.C. transitioned from using the Partnership for Assessment of Readiness for College and Careers (PARCC) assessment to measure learning outcomes, to the District of Columbia Comprehensive Assessments of Progress in Education (DC CAPE). The CAPE assessment includes English Language Arts (ELA), math, and science assessments, and is comparable to PARCC in terms of rigor.10
ELA and math learning outcomes remain below pre-pandemic levels
Post-pandemic improvements in learning outcomes were small in the most recent school year and smaller than gains in the previous year. In ELA, 34 percent of students met or exceeded expectations on the CAPE assessment, representing no change from the prior school year.11 Math results showed 23 percent of students meeting or exceeding expectations, a 1 percentage point increase from school year 2022-23.12
To put these outcomes in context, D.C.’s academic recovery from the pandemic was at least as good as other states and the country on average. Results on the 2024 National Assessment of Educational Progress (NAEP), often referred to as the Nation’s Report Card, showed that D.C. has stronger gains over two years than the nation in 4th grade math, and stayed flat in 8th grade math and reading for both tested grades while the national average declined or was flat.
Looking closer, achievement in math and ELA was lower than pre-pandemic for all six major student groups. Results were within 1 percentage point for each group aside from English Learners, who improved by 2 percentage points in ELA, relative to the previous year. Learning outcomes were lowest for students with disabilities: 6 percent of these students met or exceeded expectations on the math assessment, and 9 percent did so in ELA.13 18 percent of economically disadvantaged students met or exceeded expectations on the ELA assessment, and 8 percent did so in math (roughly half as much as pre-pandemic).14
The academic achievement gap between Black and Latino students compared to white students remains wide in both math and ELA, and similar to the previous year. The gap between results for Black and white students is 59 percentage points in ELA, and 51 percentage points between Latino students and white students. For math, the gap in outcomes is 63 percentage points between Black and white students, and 55 percentage points between Latino and white students.
In listening sessions, some parents noted their children were not being adequately challenged or supported academically, particularly in cases where students were placed in remedial classes despite having high academic potential. Some parents noted the quality of instruction is lacking, with complaints about busy work instead of meaningful homework, and concerns over the absence of textbooks or reference materials.
BOX: Elementary and Secondary School Emergency Relief (ESSER) Funds
To support pandemic recovery, schools, or Local Education Agencies (LEAs), received ESSER funds throughout the COVID-19 pandemic. This funding expired in September 2024, with the possibility for extensions under specific reasons. As of October 7th, 2024, LEAs in D.C. had spent $506.5 million of $540.5 million in pandemic relief funds (94 percent).15 The majority of resources have been spent with the purpose of accelerating learning ($333.5 million). LEAs could submit reimbursements on ESSER funds until December 2nd, 2024, or the following year if approved for liquidation extensions—so this amount does not reflect the final expenditures.
High school students
Results for high school students on the statewide assessment were about the same in ELA as for all students, with 33 percent of high school students meeting or exceeding expectations. However, in math, just 11 percent of high school students met or exceeded expectations. In contrast to these results, 76 percent of high school students described their grades as mostly A’s and B’s on the 2023 Youth Risk Behavior Survey.16 In listening sessions, some students noted inconsistency in academic rigor, with certain schools offering easy classes which don’t challenge students, while others push students harder.
Academic growth shows relative improvements for some groups
One way to measure academic growth is Median Growth Percentile (MGP), which is calculated by ordering Student Growth Percentiles (SGPs) for all students from smallest to largest and selecting the MGP as the percentile in the middle of that list (SGPs show how students’ growth compared to students who scored similarly on the statewide assessment in the previous year).17 This means that half of students in the group have a student growth percentile above the MGP, and half of the students in the group have a student growth percentile below the MGP.18
In school year 2023-24, MGP is highest for white students in both math and ELA, and above 50 for English learners in math (see Figure 8), meaning that learning outcomes for these student groups improved more compared to their academic peers. Students with disabilities and economically disadvantaged students had lower MGPs.19
Connecting learning to chronic absenteeism, during listening sessions, teachers shared that high levels of absenteeism adversely affect students’ academic and social-emotional development, leading to learning gaps and hindering students’ ability to keep up with their peers. In interviews, school leaders agreed, stating that attendance has a large impact on academic achievement.
Looking at changes in academic outcomes and changes in chronic absenteeism, a D.C. Policy Center analysis found that larger reductions in chronic absenteeism than D.C. experienced last school year will be necessary to improve learning outcomes.20 An OSSE analysis had similar findings for academic growth: a 10-percentage point increase in in-seat attendance corresponded to an average increase of 2.8 percentiles in ELA SGP and an average increase of 3.2 percentiles in math SGP.21 This means that to get this boost in growth, students would have to attend an additional 18 days of school, a large improvement in attendance.
“When students miss school, it impacts them academically, socially, and emotionally.” – Washington D.C. teacher.
“It is tough to bring to speed a student who has missed several days of class.” – Washington D.C. teacher.
“As students get older and gaps get larger, it’s just so hard to balance the teaching on grade level and what they need to know.” – Washington D.C. school leader
In interviews, school leaders attributed any improvements in learning outcomes to interventions that ranged from student-facing (high-impact tutoring, enrichment, large-scale interventions, summer academies, shifting to the science of reading) to logistical (extra staff, small class sizes, block scheduling), to educator-focused (professional development, co-creating the school’s vision with staff, and wellness for adults).
Feature: High-impact tutoring
High-impact tutoring (HIT) emerged as one strategy to accelerate learning in D.C. and across the country to address pandemic learning loss in school year 2021-22 when students returned to in-person learning. In D.C., the Office of the State Superintendent of Education (OSSE) led a three-year, $33 million dollar investment in scaling and supporting HIT across D.C., specifically focusing on students classified at-risk or those experiencing disrupted instruction during the pandemic.22 The HIT initiative awarded grants directly to 18 tutoring providers, a research partner to evaluate OSSE-funded HIT efforts, and a strategic program supports partner and funded an additional 13.23
CityTutor DC was awarded the strategic program supports grant, and in that role, the organization incubated HIT providers and supported community-based tutoring. They also provided tutoring design sprints and communities of practices to support tutoring providers and school leaders in implementing HIT programs. In school year 2022-23, this HIT initiative served 5,135 students across 141 schools, or 6 percent of students. As one early measure of impact, students who received tutoring were on average 7 percent less likely to be absent on days tutoring was scheduled. In school year 2023-24, OSSE-funded HIT programs served 6,783 students. Academically, students receiving the full dosage of HIT in either English Language Arts (ELA) or math gained learning that was equivalent to 8-22 additional school days.24
College and career readiness outcomes show small upticks
This section focuses on college and career readiness for high school students, most of whom would have been in middle school or grade 5 at the beginning of the pandemic.
Feature: Advanced Technical Center (ATC)
The Advanced Technical Center (ATC) is an example of a citywide opportunity for District high school students to access Career and Technical (CTE) courses in preparation for high-wage, high-skill careers. The ATC is currently located in Ward 5 but is open to students from all wards in the city, with transportation provided. A second location will open in Ward 8. The ATC offers courses in cybersecurity, health information technology, and general nursing. Enrollment grew from 96 students in school year 2022-23 to 191 in school year 2023-24.
High school graduation rates are steady after a post-pandemic rise
On average, four-year graduation rates improved by less than a percentage point to 76 percent in school year 2023-24. English learners and Latino students had large gains of at least 9 percentage points. All other groups of students saw a decrease in graduation rates. For context, four-year high school graduation rates are 8 percentage points higher than school year 2018-19, rising throughout the pandemic and recovery.25
Performance on advanced coursework has improved, but participation has decreased
Advanced coursework is an important measure of college and career readiness for high school students. In school year 2023-24, 63 percent of high school students participated in an Advanced Placement (AP) course, International Baccalaureate (IB) course, or dual enrollment—lower than 67 percent in the previous year.26 Out of high school students who took exams, a little over half (51 percent) passed at least one AP or IB exam, which is higher than 45 percent in the previous year.27 Passing these exams was highest for Latino students (47 percent), and white students (88 percent), and lowest for economically disadvantaged students and students with disabilities.
Share of students meeting the SAT college and career ready benchmark is steady
In school year 2023-24, 20 percent of students were identified as college and career ready according to the SAT College and Career Ready Benchmark (see Figure 11), showing no change from school year 2022-23. However, there were improvements for Black students from the previous school year (1 percentage point increase) and Latino students (3 percentage point increase). Economically disadvantaged students, English learners, and students with disabilities had the lowest levels of meeting this benchmark.
Feature: Students are excited about the future and hope to balance their dreams with real-world challenges
In listening sessions, many students said they planned to attend college, and some mentioned specific areas of study such as nursing, law, animal science, political science, and business management. Some students are excited but nervous about leaving D.C. for college, and plan to return after their studies. Some students preferred trade schools or technical camps, seeing them as more affordable and efficient paths to their careers, such as electricians, real estate agents, and tech jobs. Others were interested in international careers, inspired by internships and school events which exposed them to global opportunities.
“I want to do business management and have my own business someday.” – Washington D.C. student
“Trade school seems like a good option for me; I’m interested in learning a skilled trade and starting my career sooner.” – Washington D.C. student“Internships opened my eyes to international opportunities—I’m thinking about a career that allows me to travel the world.” – Washington D.C. student
Postsecondary college enrollment improved
The most recent data on postsecondary enrollment for the class of 2023 shows 56 percent of students enrolled in a postsecondary institution within six months of high school graduation (see Figure 12).28 This is a 3 percentage point increase from the previous class and back to pre-pandemic year levels (56 percent in school year 2018-19). White students enrolled in postsecondary institutions at the highest rates (80 percent). In this graduating cohort, 53 percent of Black students, and 51 percent of Latino students enrolled in postsecondary within six months. Students with disabilities (35 percent) and English learners (38 percent) had the lowest rates of postsecondary enrollment within six months.
Feature: Early career outcomes
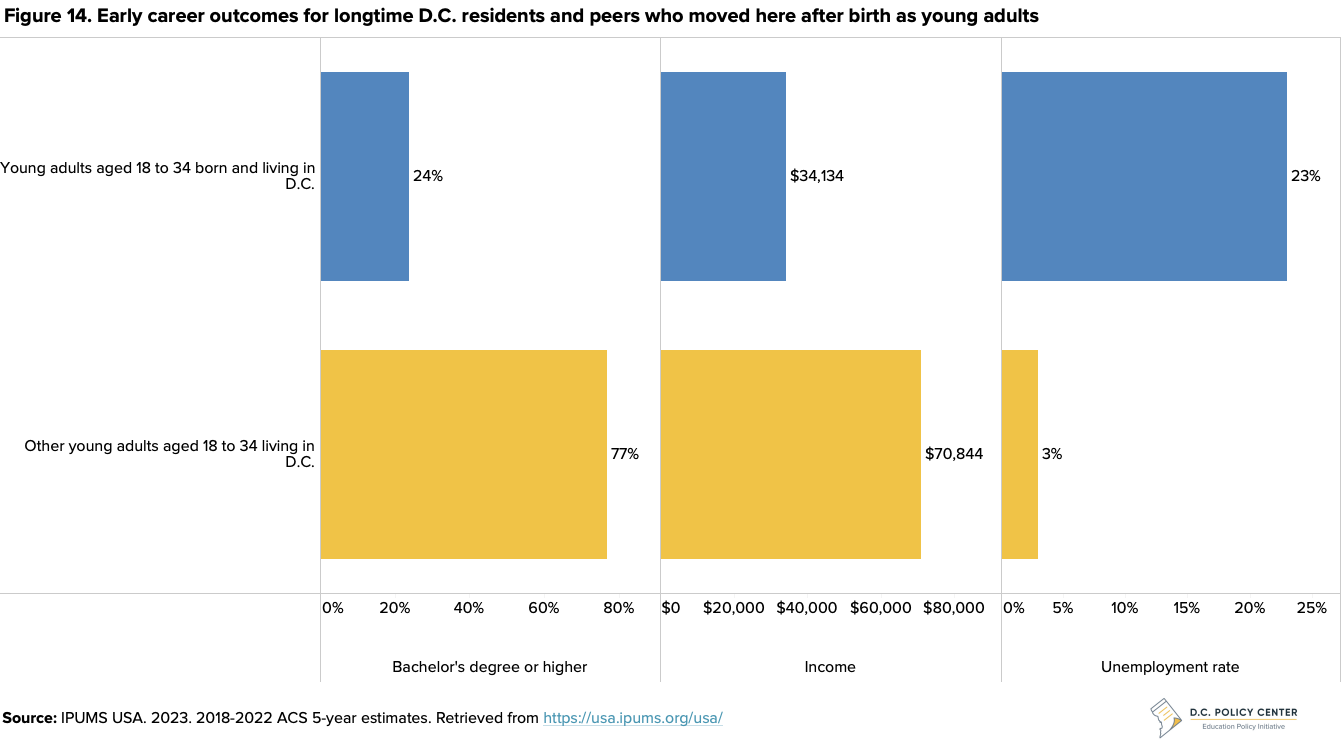
D.C. doesn’t yet have comprehensive data on early career outcomes for alumni, but American Community Survey (ACS) data suggest significant disparities in earnings and employment when compared to similarly aged youth who move to D.C later in life.29
To improve the information D.C. has about alumni, the DME has established the Office of Education Through Employment Pathways (ETEP) to support D.C. residents to access good jobs and achieve economic mobility through education and workforce programs—including development of an education through employment data system to collect, analyze, and report data on the progress of D.C. residents in education, workforce training, and employment.30
In listening sessions, students associated success with financial stability, being debt-free from college, and having the ability to pay bills without stress, as they believed this would also support their mental health. Many students viewed owning a house, buying a car, and achieving financial independence as key indicators of success. In addition, many students saw success as being able to support their immediate families, especially their mothers and siblings. Personal happiness was another important part of success, with students mentioning taking vacations, having flexible work hours, and enjoying hobbies like travel. Finally, success was tied to continuing their education, with many envisioning themselves still in college, pursuing graduate programs, or working in their desired fields such as medicine, psychology, technology, writing, or screenwriting.
“[When you are] financially stable, you don’t have to worry about paying your bills. This would help my mental health.” – Washington D.C. student
“I’ll be renting an apartment or have my own home and possibly engaged, with that amazing job in tech.” – Washington D.C. student
“My mom won’t have to work anymore because I’ll be able to take care of her.” – Washington D.C. student
“I want to have a career I enjoy, but also the time to relax, travel, and spend time with loved ones.” – Washington D.C. student
School environment
This section looks at the school environment, including the role of school, chronic absenteeism, indicators of wellbeing, discipline levels, and educator retention.
The role of school has evolved
The role of school has changed since the pandemic. In the spring of 2020 and school year 2020-21, schools generally had a smaller than usual role during virtual learning compared to parents and caregivers. During the following years of pandemic recovery, the role of school expanded, along with a large influx of federal funding, with new mental health and wrap around supports.
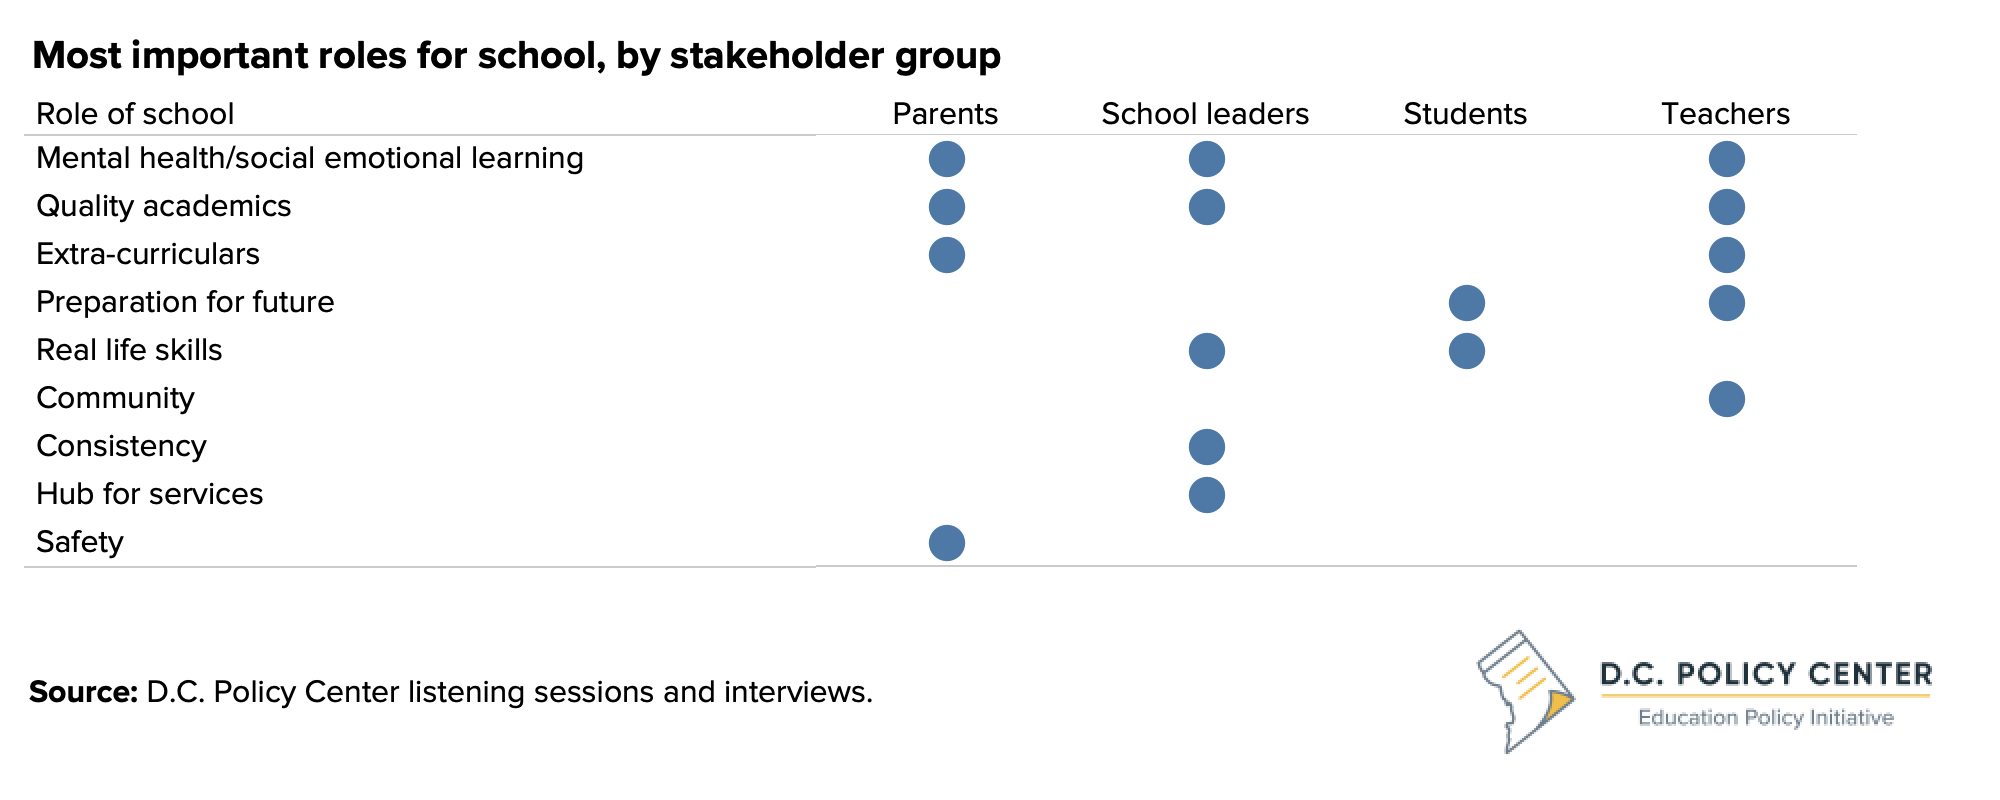
In school year 2023-24, the third year of in-person learning after the pandemic and the last year of a large amount of federal funding for recovery, the D.C. Policy Center asked students, parents and teachers about their perceptions about the role of school during listening sessions. Students in particular spoke about the need for school to prepare them for the future in practical ways, whereas parents and teachers were more concerned with academic achievement and mental health support in the present. Parents also mentioned the role of school to keep children safe, and teachers talked about the importance of creating community. Both students and parents highlighted the need for schools to support strong extracurricular opportunities.
Students wanted school to focus on real-life skills and better preparation for the future.
“More classes that we would need in life like taxes and buying a house, that’s what we should be learning.” – Washington D.C. student
On school: “See it as a job, you don’t get paid, but it teaches you responsibility.” – Washington D.C. student
“I’d like to know more about trades, like becoming an electrician.” – Washington D.C. student
Parents wanted a stronger school role in the present in the areas of academic excellence, mental health support, and safety.
“Children should feel safe in school, and there should be no fear of walking and taking transportation to school. There is no reason for children to think they need pepper spray or a knife to protect themselves, if they do then they get in trouble.” – Washington D.C. parent
Example of academic challenges: “1st grader is advanced, and there’s no accelerated program at the school. His teacher won’t let him explore educationally the way he’d like to.” – Washington D.C. parent
Teachers believed the role of school is fostering education, emotional growth, and community.
“The primary goal of school should be providing quality education. It is hard when students are dealing with trauma, but meeting academic goals is still crucial.” – Washington D.C. teacher
“We are seeing the remnants of social isolation… It is getting better, but it is still there. The school is doing a lot during specials, giving them those social skills they are lacking.” – Washington D.C. teacher
“We need to foster community within the school, making sure students feel included and supported.” – Washington D.C. teacher
Both parents and students saw schools as places not only for academic learning but also for personal development through extracurricular activities.
“[My granddaughter] is on the debate team, doing dual enrollment, and visiting different law programs.” – Washington D.C. parent
Chronic absenteeism improved modestly
Chronic absenteeism has been a persistent issue in the District even before the pandemic. In school year 2023-24, 40 percent of students were chronically absent, meaning they missed 10 percent or more of the school year for unexcused and excused absences.31 This is 4 percentage points lower than the previous school year, and in line with early data for a select group of states reporting for school year 2023-24, showing modest improvements but still above pre-pandemic levels.32 Like other states, D.C.’s chronic absenteeism is still 11 percentage points higher than pre-pandemic rates of 29 percent in school year 2018-19.33
While absenteeism is steadily declining, rates are still high, which undermines academic and socioemotional learning investments. D.C. has joined over a dozen states pledging to cut chronic absenteeism in half over five years.34 This means that chronic absenteeism will be at most 24 percent by school year 2026-27. At this pace, chronic absenteeism will need to decrease by a little more than 5 percentage points per year.
In interviews, many school leaders shared that increased student check-ins and trusted adult relationships is what contributed to their school’s attendance growth, and that more punitive measures were less helpful. In addition, they mentioned incentives, creating a sense of belonging for students and families, checking in with students on why they are missing, and educating families on where their children will be academically if they miss school.
Improvements for Black students and students with disabilities matched the average decrease in chronic absenteeism, with both groups decreasing by 4 percentage points. Along with economically disadvantaged students, chronic absenteeism rates are highest for these student groups. Other main student groups had smaller decreases than the average.
It is tough to discover the root causes of absenteeism, as the reasons are often unique to students and the particular day. In listening sessions, students mentioned that mental health, family responsibilities, and fatigue are among the top reasons they miss school. In other cases, long commutes to school or knowing a teacher wouldn’t be present sometimes discouraged students from attending regularly.
OSSE’s 2023-24 District of Columbia Attendance Report analyzed some factors influencing attendance. On early dismissal days, students were 4.5 percentage points more likely to be absent: At the 59 schools in D.C. with approval for regular early dismissal, students were likely to accumulate 1.4 additional absences over a typical 31 early dismissal days per school year. Travel time, by contrast, did not show up as important on average, and the impact of violent crime was negligible (OSSE stated that more data are needed to fully understand the impact, as the analysis did not examine crime near a school of attendance or whether students were aware of a crime happening).35
“Sometimes I just need a mental health day, and my parents understand that.” – Washington D.C. student
“If I know the teacher isn’t going to be there, I’d rather not go to class.” – Washington D.C. student
“I’ve got a lot of tardies because I oversleep or lose track of time on my phone.” – Washington D.C. student
“School is so far away, it makes me not want to go.” – Washington D.C. student
“I miss school to take care of my siblings when they’re sick or take them to doctor appointments.” – Washington D.C. student
Truancy rates
Related to chronic absenteeism, chronic truancy rates, or accruing at least 10 full-day unexcused absences over the course of the school year,36 showed a significant improvement. 30 percent of students were classified as chronically truant in 2023-24 school year—a decrease of 7 percentage points compared to the previous year. Average excused absences increased by two days per student compared to the 2022-23 school year, while average unexcused absences decreased by four days per student. Excused absences now account for a larger share of total absences compared to pre-pandemic levels.37
BOX: Relaunch of Every Day Counts! Taskforce
The Every Day Counts! Taskforce is a partnership of D.C. agencies and stakeholders that collaborate and coordinate strategies to increase student attendance and decrease truancy.38 In October 2024, the taskforce relaunched to prioritize a whole-of-government approach to support students and families.39 The taskforce will focus on engaging government agencies in systems-level supports and interventions to continue addressing attendance barriers.
Discipline levels were constant
In school year 2023-24, 6 percent of students were suspended out of school at least once, a return to pre-pandemic levels (see Figure 15).40 Black students, economically disadvantaged students, and students with disabilities all had the highest rates of out of school suspensions (9 percent respectively), higher than the overall rate of out-of-school suspensions. About 1 percent of students received an in-school suspension, a decrease from the previous year.
In listening sessions, students expressed concern over certain behavioral issues, particularly fights, unsafe conditions in schools, and lack of consistent discipline. Additionally, teachers noted that the pandemic and associated traumas have led to significant behavioral issues in students. Emotional difficulties and lack of self-regulation, particularly in younger students, were major hurdles. On the other side, parents were upset by instances of perceived inadequate response to bullying and behavioral issues.
Community safety remains an issue
Feeling safe while commuting or in neighborhoods around school or home is crucial for students. In listening sessions, many students said that they do not feel safe during their commutes, particularly on public transit. On the 2023 Youth Risk Behavior Survey, 15 percent of D.C.’s high school students reported they did not attend school because they felt unsafe at school or on their way there for at least one day in the past 30 days. This share has doubled since 2015 and is higher for Black and Latino students (14 and 16 percent, respectively) than white students (4 percent). Additionally, 33 percent of high school students reported seeing someone physically attacked, beaten, stabbed, or shot in their neighborhood.41
These concerns about and experiences with community violence were accompanied by an increase in violent crime in D.C. In school year 2023-24, homicides were up 10 percent over the previous school year. Just over half of these homicides took place in Wards 7 and 8, where students tend to travel longer distances to school and have more time on their commute: The average walk distance to school is 1.5 miles, and it is at least 2 miles for students living in Wards 7 and 8.42 Parents raised concerns that many students, especially those from Wards 7 and 8, faced significant barriers to attending school due to safety issues and the need to travel long distances.
“They say the truancy rate is because of safe passage. Kids are afraid to go to school. There are fights, and this all contributes to truancy.” – Washington D.C. parent
“In school, I feel safe, but the commute is what worries me more.” – Washington D.C. student
Student wellbeing
In addition to academics, student wellbeing was a challenge during the pandemic and the years since. It is hard to measure wellbeing using quantitative data, but as of 2023, 34 percent of D.C.’s high school students reported that they felt persistently sad or hopeless on the Youth Risk Behavior Survey, down from the previous year but up from 26 percent in 2012. On a positive note, 65 percent of students reported having at least one teacher or adult in their school building they could talk to if they had a problem, which is a promising sign. However, only 23 percent of students reported “always” or “most of the time” receiving the help they need—and this share has decreased from 28 percent in 2017. By racial group, 21 percent of Black and Latino students reported having consistent access to help, compared to 44 percent of white students, indicating significant disparities in access to support.43
Educator retention improved
In school year 2023-24, D.C.’s public schools (including DCPS and public charter schools) employed 8,767 teachers, and 74 percent of teachers were retained in their same role and same school.44 An additional 9 percent stayed at another school in D.C.45 This means that 83 percent of teachers were retained overall in the District, a 4-percentage point increase from the previous year. As of the fall of 2023, 4 percent of teaching positions were vacant, an uptick from 3 percent in the previous year. Special education positions had the highest vacancy rates during the fall of this school year (8 percent), and bilingual education was the only subject with zero vacancies.46
In listening sessions, students mentioned that the mid-year departure of teachers and staff was particularly disruptive. Many students felt that the loss of key staff members left a void in their educational and extracurricular activities.
Teachers highlighted collaboration and professional development as helping them stay and staff shortages as a challenge. In some cases, teachers were frequently pulled out of their classes to substitute for others, which led to disruptions in the quality of instruction. Complicating shortages, teachers mentioned that school budgets are often finalized too late, typically in June, after important staffing decisions have already been made in April. This delay in budget approvals can mean losing experienced teachers who may find new jobs during the gap between layoffs and rehiring.
“Having that instructional coach is key… it was nothing punitive, it was ‘I’m here to coach you and you will become a better teacher for your students.’” – Washington D.C teacher
“Budgets aren’t aligned, so people get laid off in April but then money comes back in June/July, and then the people with the most experience already get new jobs.” – Washington D.C. teacher
More school leaders stayed in their schools
In school year 2023-24, D.C.’s public schools employed 243 principals.47 Of these 243, 78 percent of principals were retained in the same school they led in school year 2022-23. 79 percent were retained overall (see Figure 20), which is similar to the previous year. In interviews, school leaders talked about kids as their primary motivation to stay in their role to see them grow—and that solving problems by providing the right resources was fulfilling. On the other hand, school leaders mentioned challenges of system constraints to solve some problems, and difficulties of balancing multiple priorities. Some highlighted supportive teams or boards and coaching opportunities that made it easier to stay in their roles.
“D.C. has pipeline into leadership, which is why I stay.” – Washington D.C. principal
Conclusion
In school year 2023-24, D.C. showed signs of strong system health and modest improvements in student outcomes toward recovery from pandemic setbacks.
On system health, enrollment increased by 2.3 percent at a time when most states are losing public school enrollment, including D.C.’s neighbors. In addition, educator retention improved, with 74 percent of teachers staying in the same role at the same school (an additional 9 percent staying in D.C schools more broadly) and 78 percent of principals remaining in leadership at their school.
On most student outcomes, progress was modest. The shares of students meeting or exceeding expectations in math and ELA improved by less than a percentage point each and are below pre-pandemic levels (by 3 percentage points in ELA and 8 percentage points in math). Chronic absenteeism improved by 4 percentage points to 40 percent and remains above pre-pandemic levels of 29 percent. At this rate, chronic absenteeism will need to improve by 5 percentage points each year to meet the city’s goal of cutting it in half over 5 years. With an improvement of 3 percentage points, a higher share of high school graduates continued to postsecondary education at a 2- or 4-year institution—returning to pre-pandemic levels.
Other key student outcomes remained steady. High school graduation rates stayed at 76 percent, 8 percentage points above pre-pandemic levels. Suspensions are also the same as pre-pandemic levels and last year.
Moving forward
Both the role of school and the amount of funding for education have changed a lot in the past few years, with the pandemic moving students to virtual learning with a smaller role for school and then recovery funds and efforts expanding the role of school in many ways. Schools are being asked to do and deliver on much more than in previous years. In listening sessions, when asked about what they think the role of school should be, students spoke about the need to prepare them for the future, and parents and teachers were more concerned with current academic achievement and mental health support. Parents also wanted schools to keep students safe, and teachers spoke about the need to create community. Both teachers and parents highlighted the need for strong extra-curricular options. These concepts represent a huge lift to deliver, and schools can benefit from partnerships and others stepping in to support these efforts.
Moving forward, there is an opportunity to build on the signs of system strength in D.C. and the slower but positive improvements to learning outcomes and chronic absenteeism to meet the urgent needs of recovery from the pandemic.
Endnotes
- Changes in the definition of chronic absenteeism make it difficult to put outcomes in context.
- Office of the State Superintendent of Education (OSSE). 2024. Enrollment Audit Information for FY2007-FY2024. OSSE. Retrieved from https://osse.dc.gov/enrollment
- Institute of Education Sciences (IES), National Center for Education Statistics (NCES). 2024. “NCES Data Show Public School Enrollment Held Steady Overall From Fall 2022 to Fall 2023.” IES NCES. Retrieved from https://nces.ed.gov/whatsnew/press_releases/12_5_2024.asp
- Institute of Education Sciences (IES), National Center for Education Statistics (NCES). 2024. “NCES Data Show Public School Enrollment Held Steady Overall From Fall 2022 to Fall 2023.” IES NCES. Retrieved from https://nces.ed.gov/whatsnew/press_releases/12_5_2024.asp
- Office of the Deputy Mayor for Education (DME) 2024. EdScape: Public school enrollment by special needs categories. DME. Retrieved from https://edscape.dc.gov/
- Office of the Deputy Mayor for Education (DME). 2024. EdScape: Public school enrollment by race/ethnicity. DME. Retrieved from https://edscape.dc.gov/
- Office of the Deputy Mayor for Education (DME). 2024. EdScape: Trends in enrollment by sector. DME. Retrieved from https://edscape.dc.gov
- Council of the District of Columbia. 2024. Office of the State Superintendent of Education (OSSE) – Responses to Fiscal Year 2023 Performance Oversight Questions. DC Council. Retrieved from https://dccouncil.gov/wp-content/uploads/2024/08/FY23-OSSE-Performance-Oversight-Hearing-Council-Responses.pdf
- Council of the District of Columbia. 2024. Office of the State Superintendent of Education (OSSE) – Responses to Fiscal Year 2023 Performance Oversight Questions. DC Council. Retrieved from https://dccouncil.gov/wp-content/uploads/2024/08/FY23-OSSE-Performance-Oversight-Hearing-Council-Responses.pdf
- Office of the State Superintendent of Education (OSSE). 2024. “DC Cape.” OSSE. Retrieved from https://osse.dc.gov/dccape
- Office of the State Superintendent of Education (OSSE). District of Columbia Statewide Assessment Results from 2018-19, 2021-22, 2022-23, and 2023-24. OSSE. Retrieved from https://osse.dc.gov/page/data-and-reports-0
- Office of the State Superintendent of Education (OSSE). District of Columbia Statewide Assessment Results from 2018-19, 2021-22, 2022-23, and 2023-24. OSSE. Retrieved from https://osse.dc.gov/page/data-and-reports-0
- Office of the State Superintendent of Education (OSSE). 2024. “2023-24 Statewide Assessment Results and Resources.” OSSE. Retrieved from https://osse.dc.gov/node/1728216
- Office of the State Superintendent of Education (OSSE). 2024. “2023-24 Statewide Assessment Results and Resources.” OSSE. Retrieved from https://osse.dc.gov/node/1728216
- Office of the State Superintendent of Education (OSSE). 2024. “LEA ESSER Dashboard.” OSSE. Retrieved from https://osse.dc.gov/page/lea-esser-dashboard
- Office of the State Superintendent of Education (OSSE). 2024. “2023 DC Youth Risk Behavior Survey Data Files.” OSSE. Retrieved from https://osse.dc.gov/node/1734341
- Office of the State Superintendent for Education (OSSE). 2024. 2024 DC School Report Card Technical Guide. OSSE. Retrieved from https://osse.dc.gov/sites/default/files/dc/sites/osse/page_content/attachments/2024%20Report%20Card%20Technical%20Guide%20-%20November%20Updates.pdf
- Coffin, C., & Mason, H. 2024. State of D.C. Schools, 2022-23: Challenges to pandemic recovery in a new normal. D.C. Policy Center. Retrieved from https://www.dcpolicycenter.org/publications/state-of-dc-schools-2022-23/
- Office of the State Superintendent of Education (OSSE). 2024. “DC School Report Card – Assessment metric scores for school years 2022-23 and 2023-24.” OSSE. Retrieved from https://osse.dc.gov/page/dc-school-report-card-resource-library
- Coffin, C. 2024. “D.C. statewide assessments results show little improvement and a need for large decreases in chronic absenteeism.” D.C. Policy Center. Retrieved from https://www.dcpolicycenter.org/publications/d-c-statewide-assessments-results-show-little-improvement-and-a-need-for-large-decreases-in-chronic-absenteeism/
- Office of the State Superintendent of Education (OSSE). 2024. District of Columbia Attendance Report: School Year 2023-24. OSSE. Retrieved from https://osse.dc.gov/attendancesy202324
- Office of the State Superintendent of Education (OSSE). 2025. High-Impact Tutoring Report: Fiscal Year 2024. OSSE. Retrieved from https://lims.dccouncil.gov/downloads/LIMS/56867/Introduction/RC26-0004-Introduction.pdf?Id=204258
- Office of the State Superintendent of Education (OSSE). 2025. High-Impact Tutoring Report: Fiscal Year 2024. OSSE. Retrieved from https://lims.dccouncil.gov/downloads/LIMS/56867/Introduction/RC26-0004-Introduction.pdf?Id=204258
- Office of the State Superintendent of Education (OSSE). 2025. High-Impact Tutoring Report: Fiscal Year 2024. OSSE. Retrieved from https://lims.dccouncil.gov/downloads/LIMS/56867/Introduction/RC26-0004-Introduction.pdf?Id=204258
- Office of the State Superintendent of Education (OSSE). 2024. “DC School Report Card – Four-Year Graduation Rate for school years 2018-19, 2021-22, 2022-23, and 2023-24.” OSSE. Retrieved from https://schoolreportcard.dc.gov/state/report/explore/109
- Office of the State Superintendent of Education (OSSE). 2024. “DC School Report Card – College and Career Readiness.” OSSE. Retrieved from https://schoolreportcard.dc.gov/state/report/explore/103
- Office of the State Superintendent of Education (OSSE). 2024. “DC School Report Card – Advanced coursework and SAT-metric scores for school years 2021-22, 2022-23, and 2023-24.” OSSE. Retrieved from https://osse.dc.gov/page/dc-school-report-card-resource-library
- Office of the State Superintendent of Education (OSSE). 2024. “DC School Report Card – Graduation and College Enrollment – Metric Scores for school years 2017-19, 2018-19, 2019-20, 2020-21, 2021-22, and 2022-23.” OSSE. Retrieved from https://osse.dc.gov/page/dc-school-report-card-resource-library
- Coffin, C., & Mason, H. 2024. Building career assets for lifelong success. D.C. Policy Center. Retrieved from https://www.dcpolicycenter.org/publications/building-career-assets-for-lifelong-success/
- Office of the Deputy Mayor for Education (DME). 2024. “Launching DC’s Education Through Employment Data System.” DME. Retrieved from https://dme.dc.gov/sites/default/files/dc/sites/dme/page_content/attachments/Launching%20DC%27s%20Education%20Through%20Employment%20Data%20Systemv2.pdf
- Office of the State Superintendent of Education (OSSE). 2024. “2023-24 School Year Attendance Reporting.” OSSE. Retrieved from https://osse.dc.gov/node/1720676
- Malkus, Nat. 2024. “The Latest Chronic Absenteeism Numbers.” American Enterprise Institute. Retrieved from https://www.aei.org/education/the-latest-chronic-absenteeism-numbers/
- Coffin, C., & Mason, H. 2024. State of D.C. Schools, 2022-23: Challenges to pandemic recovery in a new normal. D.C. Policy Center. Retrieved from https://www.dcpolicycenter.org/publications/state-of-dc-schools-2022-23/
- Office of the State Superintendent of Education (OSSE). 2024. “Bowser Administration Announces Continued Improvement in School Attendance for DC Students.” OSSE. Retrieved from https://osse.dc.gov/release/bowser-administration-announces-continued-improvement-school-attendance-dc-students
- Office of the State Superintendent of Education (OSSE). 2024. District of Columbia Attendance Report: School Year 2023-24. OSSE. Retrieved from https://osse.dc.gov/attendancesy202324
- Office of the State Superintendent of Education (OSSE). 2024. District of Columbia Attendance Report: School year 2023-24. OSSE. Retrieved from https://osse.dc.gov/sites/default/files/dc/sites/osse/page_content/attachments/2023-24%20Attendance%20Report%20%28Final%29.pdf
- Office of the State Superintendent of Education (OSSE). 2024. District of Columbia Attendance Report: School Year 2023-24. OSSE. Retrieved from https://osse.dc.gov/attendancesy202324
- District of Columbia Government. “Every Day Counts! Taskforce.” D.C. Government. Retrieved from https://attendance.dc.gov/page/every-day-counts-taskforce
- Office of the State Superintendent of Education (OSSE). 2024. “Bowser Administration Announces Continued Improvement in School Attendance for DC Students.” OSSE. Retrieved from https://osse.dc.gov/release/bowser-administration-announces-continued-improvement-school-attendance-dc-students
- Office of the State Superintendent of Education (OSSE). 2024. ”DC School Report Card data – School Discipline for school years 2018-19, 2021-22, 2022-23, and 2023-24.” OSSE. Retrieved from https://schoolreportcard.dc.gov/state/report#measure-104
- Office of the State Superintendent of Education (OSSE). 2024. “2023 DC Youth Risk Behavior Survey Data Files.” OSSE. Retrieved from https://osse.dc.gov/node/1734341
- Office of the Deputy Mayor for Education. DME. “EdScape: Trends in Distance to School by Where Student Lives.” DME. Retrieved from https://edscape.dc.gov/page/trends-distance-school-where-student-lives
- Office of the State Superintendent of Education (OSSE). 2024. “2023 DC Youth Risk Behavior Survey Data Files.” OSSE. Retrieved from https://osse.dc.gov/node/1734341
- Office of the State Superintendent of Education (OSSE). 2024. “2023-24 District of Columbia Educator Retention Brief.” OSSE. Retrieved from https://osse.dc.gov/sites/default/files/dc/sites/osse/page_content/attachments/2024%20ERB.pdf
- Office of the State Superintendent of Education (OSSE). 2024. “2023-24 District of Columbia Educator Retention Brief.” OSSE. Retrieved from https://osse.dc.gov/sites/default/files/dc/sites/osse/page_content/attachments/2024%20ERB.pdf
- Office of the State Superintendent of Education (OSSE). 2024. “2023-24 District of Columbia Educator Retention Brief.” OSSE. Retrieved from https://osse.dc.gov/sites/default/files/dc/sites/osse/page_content/attachments/2024%20ERB.pdf
- Office of the State Superintendent of Education (OSSE). 2024. “2023-24 District of Columbia Educator Retention Brief.” OSSE. Retrieved from https://osse.dc.gov/sites/default/files/dc/sites/osse/page_content/attachments/2024%20ERB.pdf