Summers in D.C. are infamously muggy, a wretched heat that’s compounded by oppressive humidity. Even within the District’s borders, however, the actual temperature and level of sun exposure can vary greatly. This article will look at where you can hide from the heat when the temperatures start to climb, and which neighborhoods are most at risk of negative heat-related health outcomes.
What is an urban heat island?
Those of us who live and work in D.C. during the summer know all too well that we experience a more intense heat than the rest of the region. The reality is that D.C. is an urban heat island, both at the city-level (it is hotter than neighboring counties) and at varying intensities within its borders. Urban areas often contain sources of additional heat in the form of infrastructure, car exhaust, or heat-absorbent materials such as asphalt and concrete. Those living in denser urban communities are more likely to face temperatures well above the area average on any particular summer day.
Where are the hot spots in D.C.?
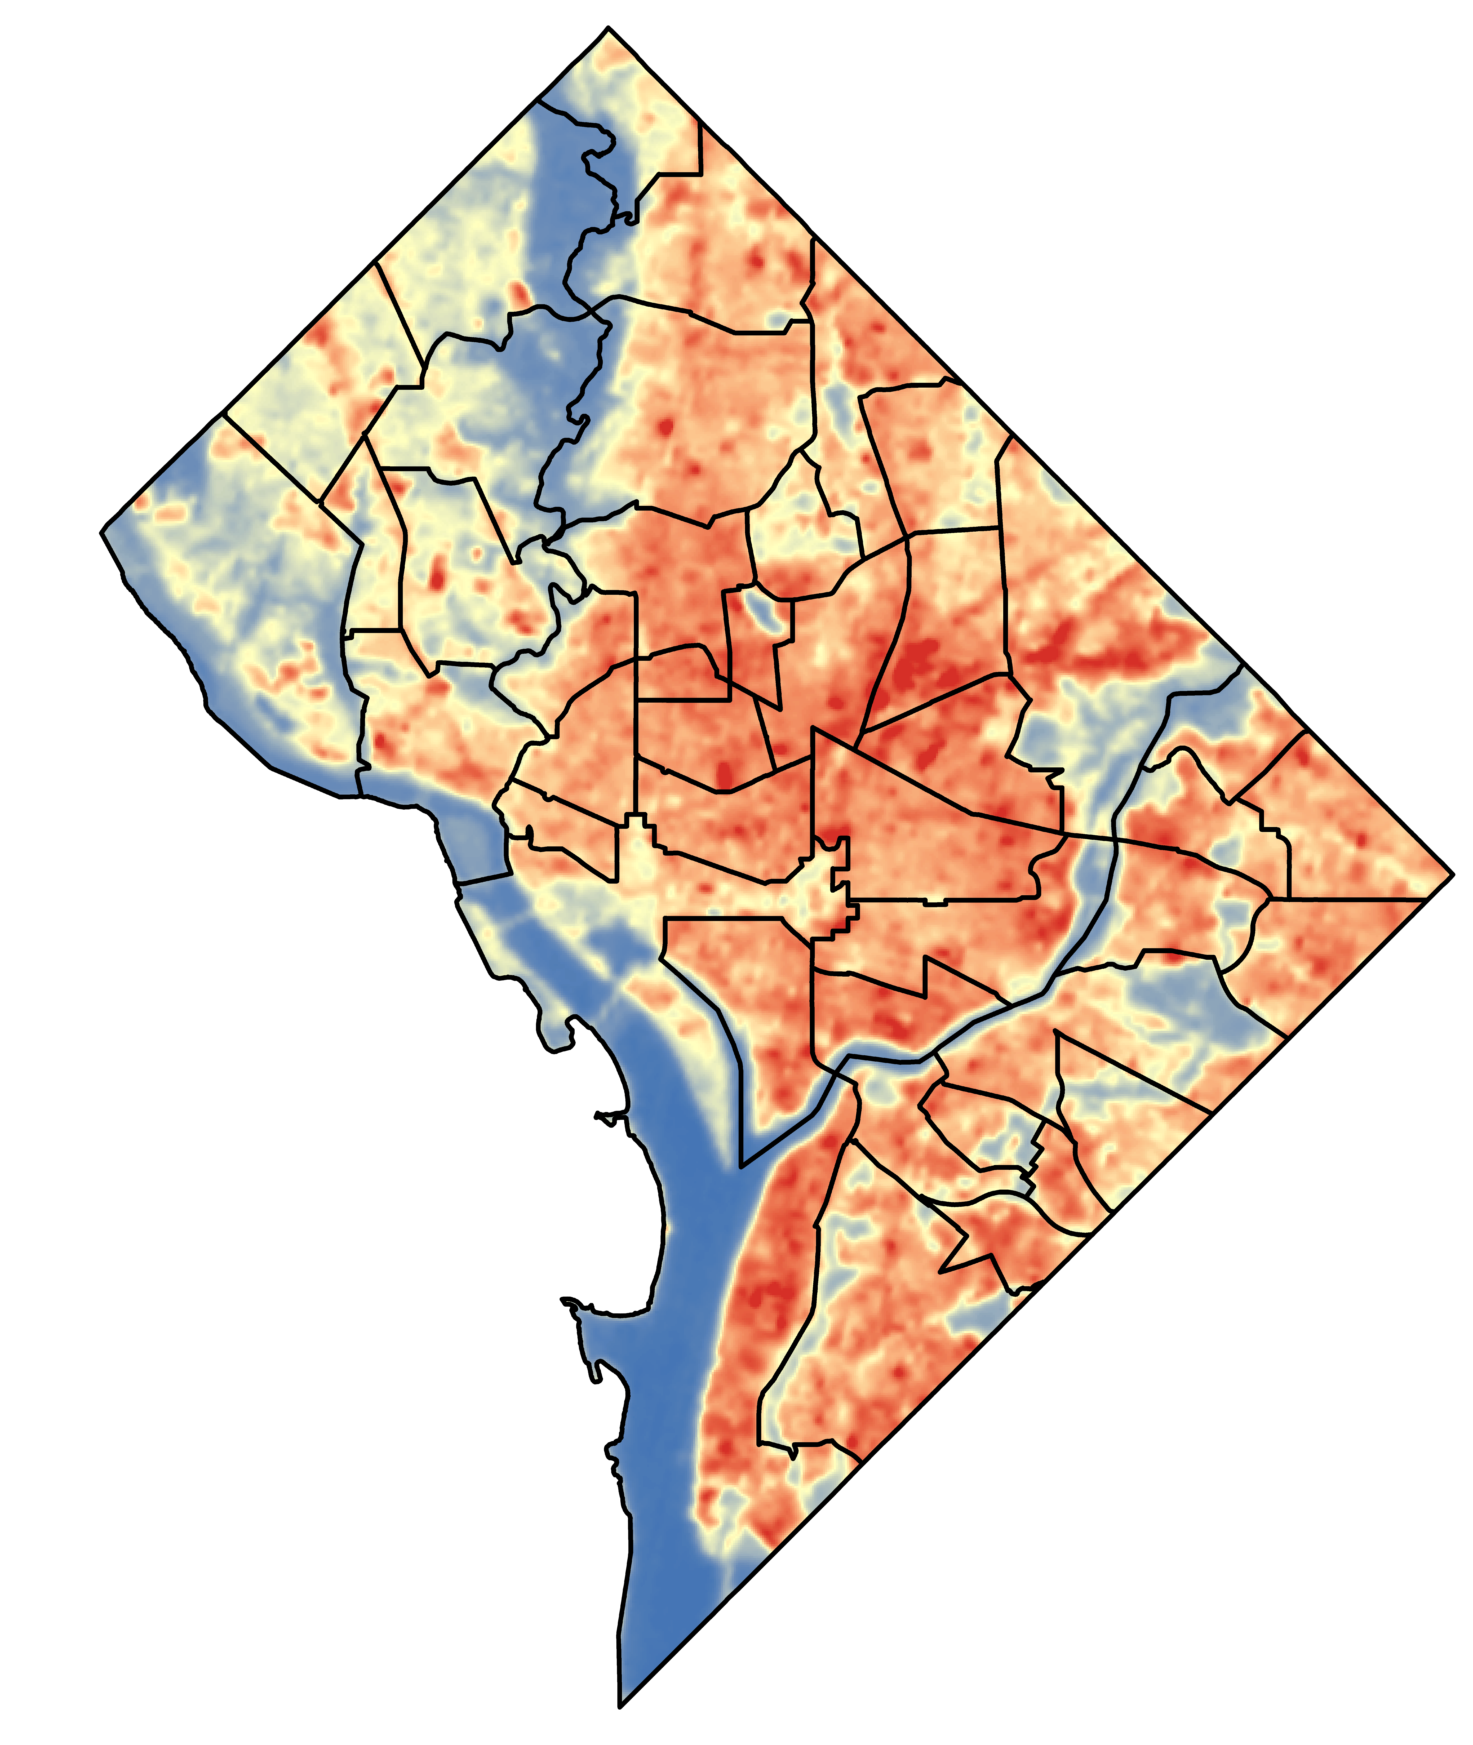
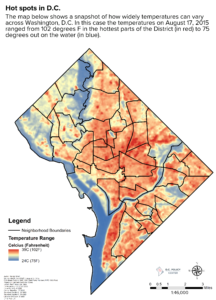
The map below shows D.C.’s temperature range, derived from NASA’s Landsat 8 satellite on August 17, 2015 at around 3pm. On that particular day and at that time, the officially recorded temperature was 93°F. However, as you can see, the map of D.C. shows a wide range of “true” values at that time of day, from 75°F (surface temperature of the Potomac River, however, sections of Rock Creek Park were 76°F) to 102°F in neighborhoods such as Ivy City, Trinidad, and the Navy Yard. Adjusting for humidity, the heat index in many of those neighborhoods easily reached 115°F
Where are the trees?
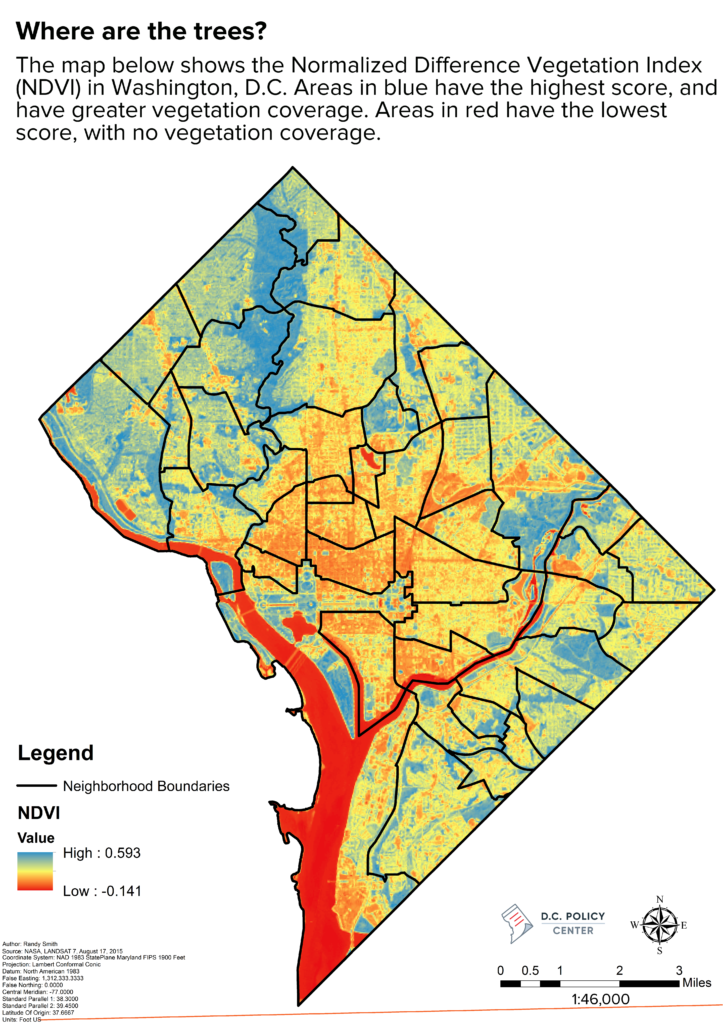
One mitigating factor of urban heat islands is vegetation. Parks, street trees, and green space can aid in cooling their surrounding areas. You can see the impact of parks and other green spaces in the map below, which shows the Normalized Difference Vegetation Index (NDVI) in D.C.—the amount of live green vegetation in an area. The index varies on a scale from -1 to 1. Values between -1 and 0 are usually bodies of water, and you can see the Potomac and Anacostia Rivers in bright red. Meanwhile, positive values range from 0 (asphalt, concrete, and bare soil) to 1 (tropical rainforest); in D.C., the highest NDVI value is around 0.59, in the blue-marked areas like Rock Creek Park.
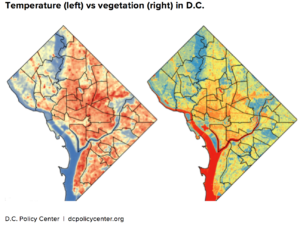
It’s immediately noticeable that the NDVI map is practically an inverse of the temperature map, with the exception of waterways; further analysis shows a strong (negative) correlation between NDVI and temperature in these areas. In other words, areas of land with high levels of vegetation also tend to have lower temperatures in the summer. (The surface temperature is technically cooler on the surface of the water, but since you’ll be exposed to the sun, it might not feel that way to you!) If you want to beat the heat in D.C. this month, head to tree-filled spots like Rock Creek Park, Fort Dupont Park, or the Arboretum.

Who is vulnerable during a hot weather event in D.C.?
When extreme hot weather events hit D.C., heat is no longer a minor annoyance—it is a life-threating natural phenomena. In D.C., an “extreme heat event” is defined as when the heat index reaches 95°F and the local heat emergency plan is implemented. Heat waves have the worst health effects in urban areas where there are larger concentrations of people who are particularly vulnerable to the heat. Many factors can influence who might be vulnerable to hot weather events.
Multiple studies on the subject agree on a variety of variables that contribute to the vulnerability of populations; certain groups are considered “at-risk” during an extreme heat event because they may be less likely to or unable to seek medical help should they suffer from heat related illnesses, often for intersecting and overlapping reasons. Adults ages 65 and older and children are two of the most vulnerable groups, as are those with underlying conditions (such as diabetes or cardiovascular disease) or experiencing persistently poor physical health. Studies have also found that people living below the poverty line, those with lower levels of education, those without health insurance, non-white populations, and adults who are living alone are at heightened risk for heat-related illnesses and death, especially if they are 65 or older.[1]
Cities often make a special effort to conduct outreach to members of vulnerable groups before and during heat events, but getting people to act can be a challenge. For example, adults 65 and older tend to have higher mortality rates during heat waves, either in direct response to the heat itself or because the heat exacerbated other conditions or illnesses. However, one study of four North American cities found that most older adults did not view themselves as particularly vulnerable to the heat, and less than half changed their behavior in any way in response to heat warnings. Those that did change their behavior did not always do so in ways that made them safer. For instance, while many older adults recalled advice that they should “stay inside,” some stayed in their homes with the windows closed and a fan on (without air conditioning)—a situation that “can rapidly enhance dehydration, and inhibit radiative and conductive heat loss.”[2] And even among those who had air conditioning, about a third said that cost was a factor when deciding when to use it. (For more information on how to stay safe in hot weather events, see the CDC’s heat safety recommendations and list of warning signs for heat-related illnesses, as well D.C.’s Heat Emergency Information at DOH.)
Identifying which neighborhoods are most vulnerable to heat-related illnesses with the Heat Vulnerability Index
Using composites of social, economic, and health-related demographics, along with temperature and vegetation variability, influenced by several studies, I created a Heat Vulnerability Index (HVI) to locate populations that are at an increased risk of heat stroke or other heat-related illnesses.[3] The map below visualizes heat vulnerability at the census tract resolution, with neighborhood clusters outline in black.
HVI Scores range from 0 to 1, with 0 indicating the existence of little to no vulnerable populations and 1 indicating the largest vulnerable populations live in those areas.[4] The map also includes layers indicating the locations of pools, spray parks, libraries, and other designated cooling centers. Cooling centers are air-conditioned District buildings where people can find relief from the heat. They include many senior centers, emergency shelters, and government buildings such as the Reeves Center. Update 7/2/2018: The information on this map is from 2017; for current information on cooling centers and other heat-related resources, visit dc.gov/page/heat-emergency-information or call 311.
Click here for a full-screen version.
As the map shows, the neighborhoods at highest risk of heat stroke or heat-related illnesses include those of Buzzard Point, Edgewood, and Washington Highlands. Data such as this can aid in strategic planning during extreme heat events and prioritize resources such as temporary cooling centers and increased educational outreach in high-risk neighborhoods where facilities are lacking.
About the data
Social and economic demographic data acquired from the U.S. Census Bureau’s American Community Survey, 2015. Health data acquired from the Center for Disease Control, 2014. Imagery used to derive temperature and NDVI values acquired from NASA’s Landsat 8 satellite and downloaded from the USGS’s Earth Explorer repository. You can find complete code for the analysis and visuals on my github page. A complete write-up of how the Heat Variability Index was calculated is now available on the D.C. Policy Center Data Blog.
Notes
[1] Sources include:
- Schwartz, “Who is sensitive to extremes of temperature?: A case-only analysis.” (2005) https://www.ncbi.nlm.nih.gov/pubmed/15613947
- Whitman et al., “Mortality in Chicago attributed to the July 1995 heat wave.” (1997) https://www.ncbi.nlm.nih.gov/pubmed/9314806
- M.S. O’Neill and K.L. Ebi, “Temperature extremes and health: impacts of climate variability and change in the United States.” (2009) https://www.ncbi.nlm.nih.gov/pubmed/19136869
- Berko et al., “Deaths Attributed to Heat, Cold, and Other Weather Events in the United States, 2006–2010.” (2014) https://www.cdc.gov/nchs/data/nhsr/nhsr076.pdf
[2] S.C. Sheridan, “A survey of public perception and response to heat warnings across four North American cities: an evaluation of municipal effectiveness.” (2007) https://www.ncbi.nlm.nih.gov/pubmed/17024398
[3] It should be noted that vulnerability to heat is often a dynamic topic. The overall utility of an index is sensitive to scale, measurement, and context. More: Wen-Ching Chuang and Patricia Gober, “Predicting Hospitalization for Heat-Related Illness at the Census-Tract Level: Accuracy of a Generic Heat Vulnerability Index in Phoenix, Arizona (USA).” (2015) https://ehp.niehs.nih.gov/1307868/
[4] Due to available data sources, this index is based on data on District adults, but children are also particularly vulnerable to extreme heat events.
Original feature photo of Georgetown fountains by Ted Eytan.
D.C. Policy Center Senior Fellow Randy Smith is a Geographic Information Systems (GIS) Specialist and a lecturer at Hood College in Frederick, MD. He has an MSc in Geospatial and Mapping Science from the University of Glasgow. He has a passion for maps, baking, and running. He lives in Tenleytown with his wife.


