In D.C., public school students may ride Metrobus or Metrorail at no cost through the Kids Ride Free program, as there is no school bus service (with the exception of transportation provided for some students with certain special education needs).
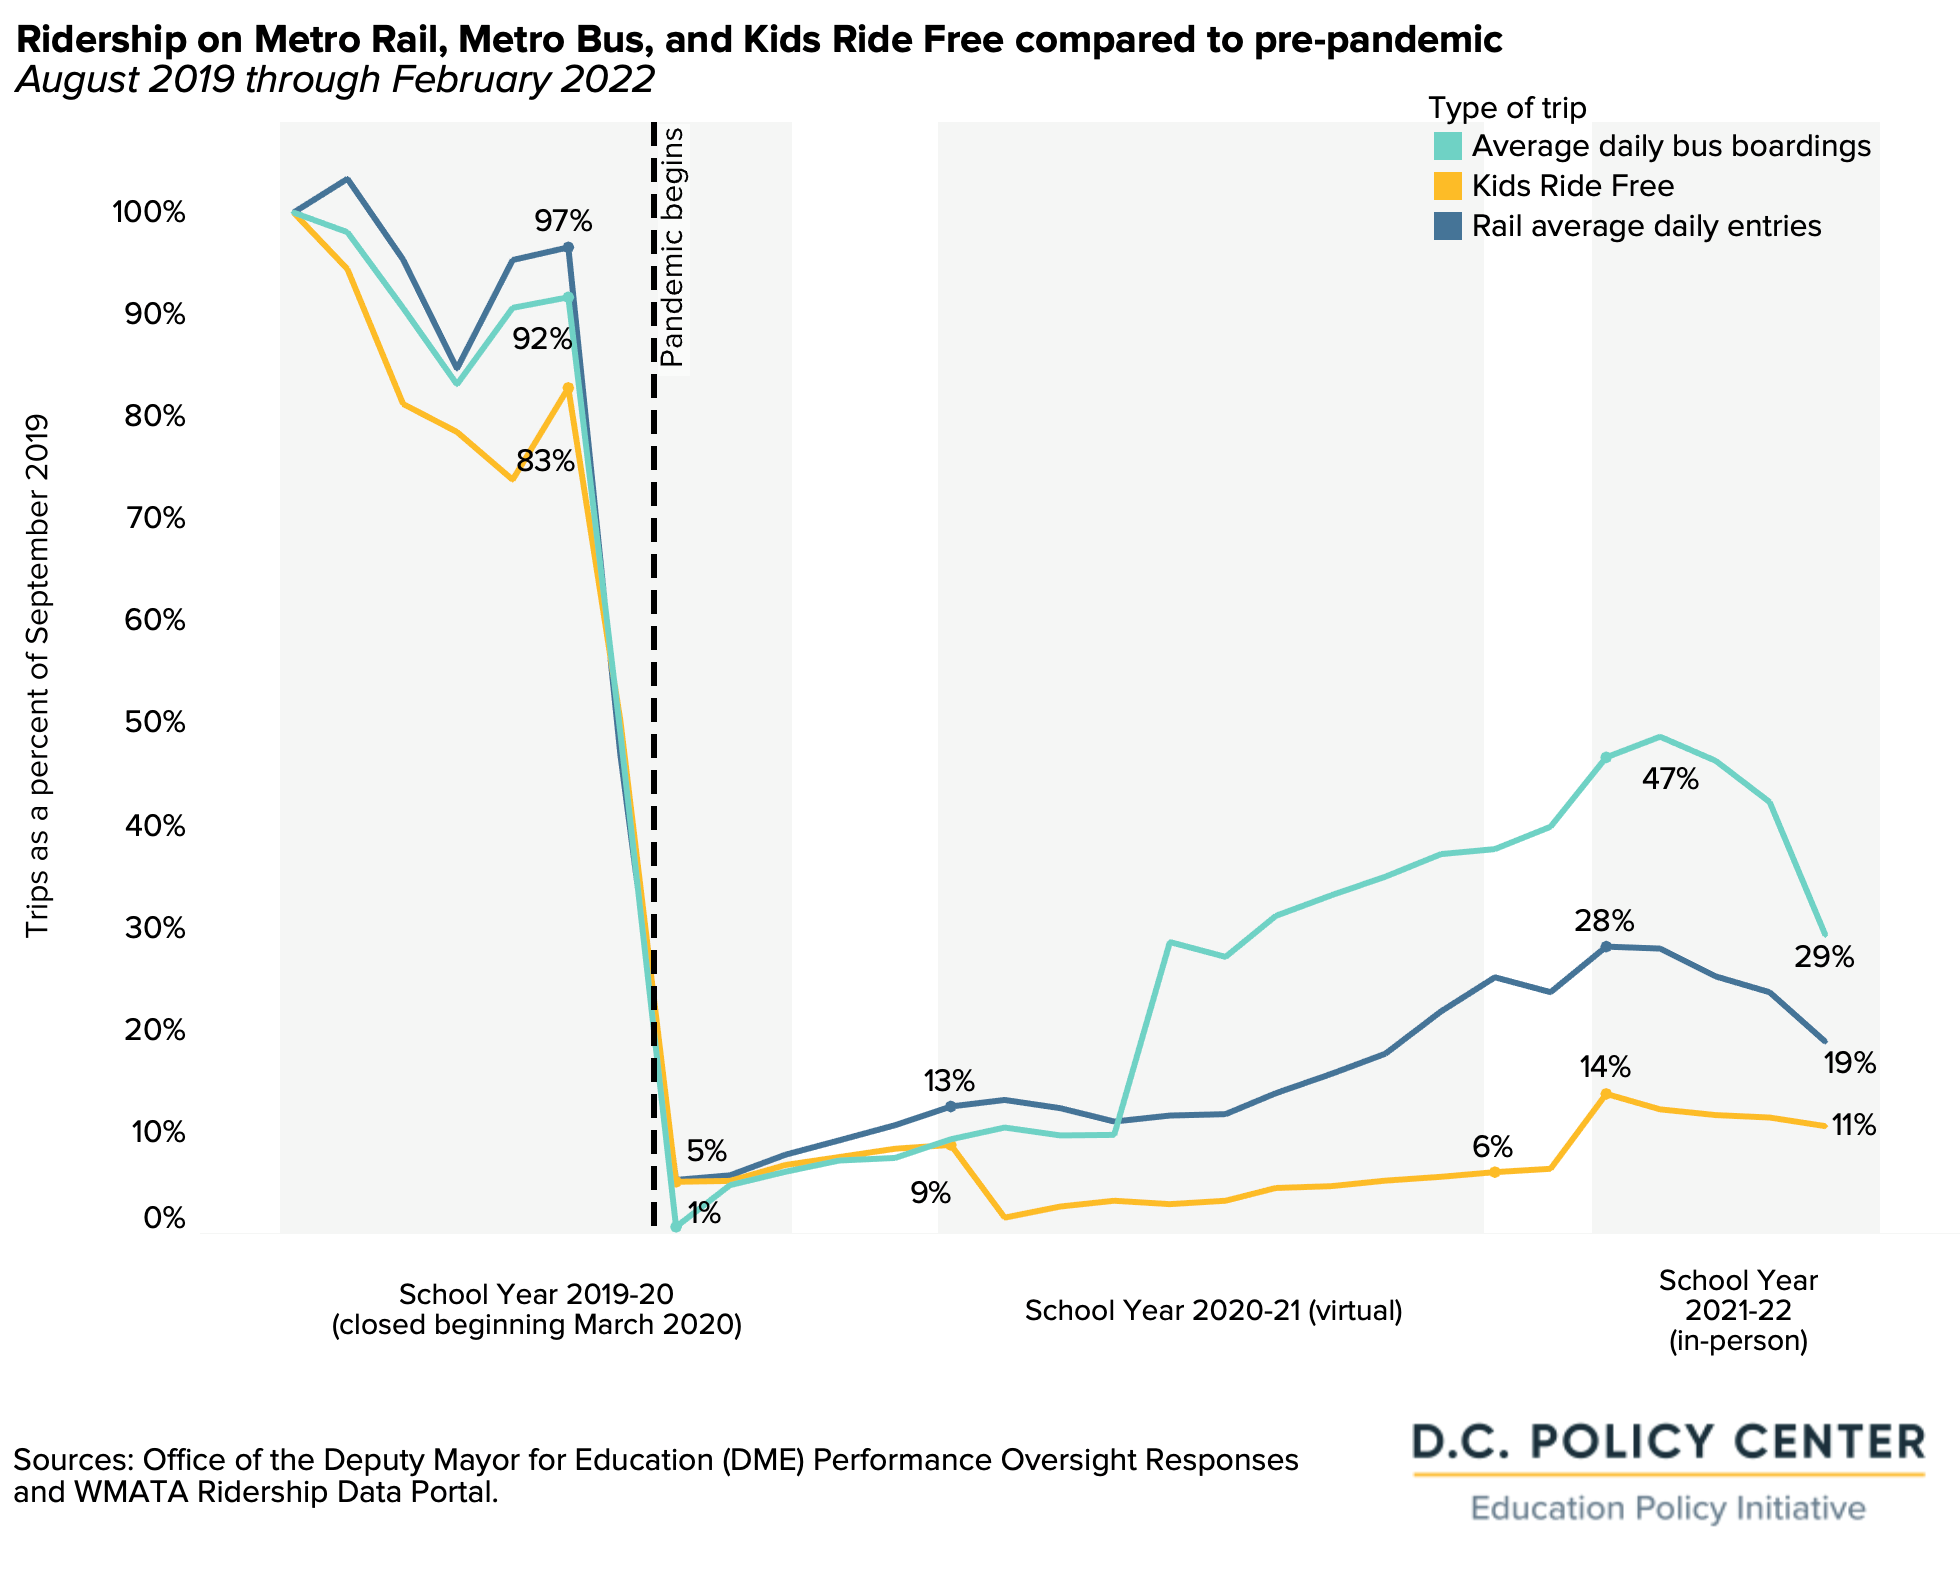
As of January 2022, student ridership on public transit, as measured by Kids Ride Free trips, was 11 percent of pre-pandemic levels (September 2019), according to data from the Office of the Deputy Mayor for Education’s Performance Oversight data for FY21 and FY20.1
The relatively low usage from August 2020 through June 2021 is expected, given that the majority of students learned virtually through the 2020-21 school year,2 and this low student usage was aligned with the general public’s usage of Metro and bus services. Kids Ride Free trips did increase slightly at the beginning of school year 2021-22, which marked a return to in-person school for many students. However, student ridership remains low, even lagging behind usage by the general public.3
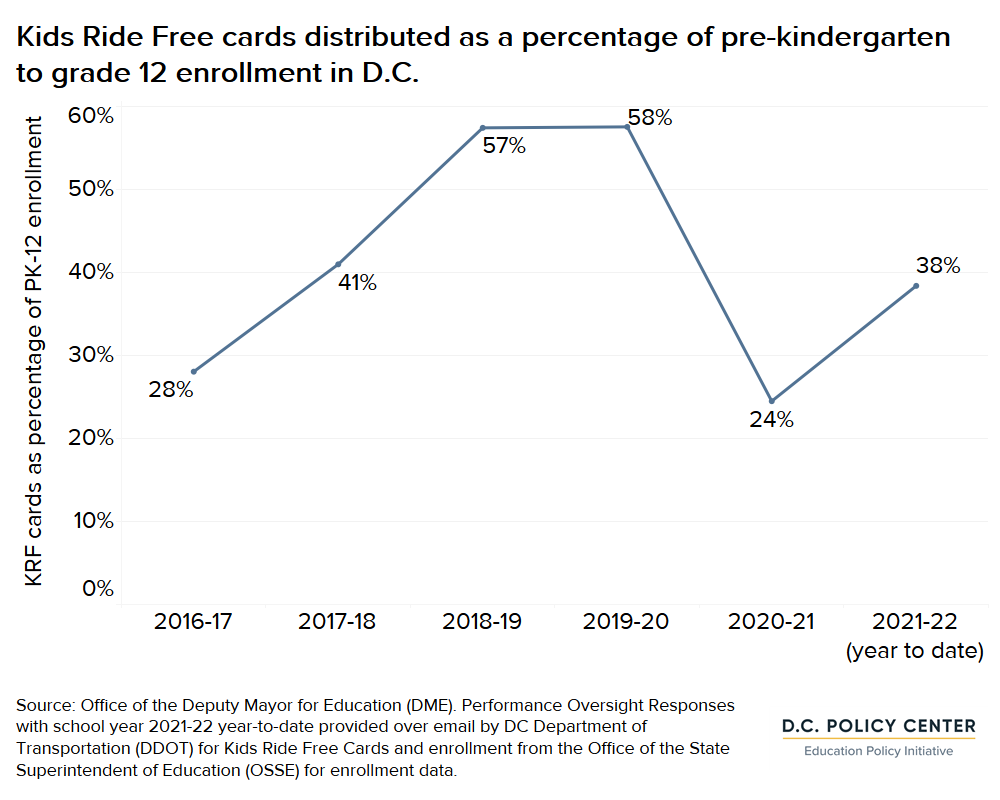
It is not clear why Kids Ride Free ridership is down. One reason could be that Kids Ride Free card distribution was lower in school year 2021-22, at 38 percent of pre-kindergarten to grade 12 enrollment (year-to-date in June), compared to 58 percent of enrollment in school year 2019-20. Another reason could be that fare evasion, which was on the rise before the pandemic (an estimated 15 percent of Metrobus trips in FY2019, for example), could be continuing to increase.4
Or preferences could be weaker for public transit due to increased violent crime during the pandemic,5 COVID-19 concerns, or reductions and disruptions to service.

Kids Ride Free trips show the extent to which students are using public transit to get to school in D.C., where the median walk distance to school is 1.5 miles—and even farther for students in Ward 7 (2.2 miles) and Ward 8 (2 miles).6
These distances mean that many students attend schools that are too far to walk to, and instead students rely on public transit, private car, or biking. Lower student ridership on public transit could explain part of the story behind higher absenteeism rates that some schools experienced in school year 2021-22, which in turn has an impact on student achievement.7
Endnotes
- For more information, visit https://dccouncil.us/wp-content/uploads/2021/03/DME_FY20-Performance-Oversight-Responses_FINAL.pdf and https://www.dropbox.com/sh/a9c91dqy6nmas9t/AAB_Nj3chorlKhL-vnDI2GiOa/.2022%20Past%20Hearings/3.3.22%20Performance%20(Education%20Government)?dl=0&subfolder_nav_tracking=1
- D.C. Policy Center. 2022. State of D.C. Schools, 2020-21. D.C. Policy Center. Retrieved from https://www.dcpolicycenter.org/publications/state-of-dc-schools-20-21/
- Washington Metropolitan Area Transit Authority (WMATA). 2022. Ridership Data Portal. WMATA. Retrieved from https://www.wmata.com/initiatives/ridership-portal/
- Zickuhr, K. 2020. “What is the impact of fare evasion in D.C.?” D.C. Policy Center. Retrieved from https://www.dcpolicycenter.org/publications/fare-evasion-data/
- D.C. Policy Center. 2022. State of D.C. Schools, 2020-21. D.C. Policy Center. Retrieved from https://www.dcpolicycenter.org/publications/state-of-dc-schools-20-21/
- Office of the Deputy Mayor for Education (DME). 2022. “EdScape: Trends in Distance to School by Where Student Lives.” DME. Retrieved from https://edscape.dc.gov/
- EmpowerK12. 2022. ”Chronic Absenteeism is Up. Bright Spot Schools Use These 6 Strategies.” EmpowerK12. Retrieved from https://www.empowerk12.org/blog/absenteeism-bright-spots
