This publication is adapted from 2024 State of Business Report: Creating a thriving business environment. This report was prepared for the DC Chamber of Commerce, with support received from the Office of the Deputy Mayor for Planning and Economic Development. Access the full, print-friendly PDF report, including a foreword from the Chamber of Commerce President & CEO, and the Chamber’s policy agenda, here.
Other reports in this series:
- 2023 State of Business Report: Doing Business Under Fiscal Distress
- 2022 State of Business Report: Doing Business Under the New Normal
- 2021 State of Business Report: Building Back
- 2020 State of Business Report: Pivoting from Pandemic to Recovery
- 2019 State of Business Report: Building a Competitive City
- 2018 State of Business Report: Towards a More Inclusive Economy
- 2017 State of Business in the District of Columbia: Twenty years of change since the Revitalization Act
Executive Summary
Through 2023 and the first half of 2024, Washington D.C.’s economy continued to navigate challenges stemming from the increase in remote work. While there has been a slight uptick in commuting activity, office occupancy remains below half of pre-pandemic levels, leading to higher vacancy rates and substantial discounts on office building valuations. Resident employment has rebounded to pre-pandemic levels, but overall employment in the city has not yet fully recovered.
In this challenging and uncertain environment, businesses in the District of Columbia have shown tremendous resilience. Entrepreneurial activity in D.C. remains higher than pre-pandemic levels, although some signs of weakening are becoming increasingly evident. The city continues to see new business formations but also faces higher closure rates and slower growth in new business applications.
The 2024 State of Business Report: Creating a thriving business environment examines how business and economic activity in the District have changed in the past few years, how the local labor market performed, and what policymakers can do to foster an environment that maximizes business success in the District of Columbia. With weakening finances and limited resources, the District must turn to policies that can unleash growth and innovation and sharpen the city’s competitive edge.
To ensure long-term economic vitality, the District of Columbia must focus on creating a thriving business environment. This entails implementing strategic measures that support and attract businesses, streamline operations, and foster an atmosphere of innovation and growth.
Key Policy Recommendations:
Streamline Regulations
Regularly review and modernize business regulations to ensure they are not overly burdensome and address the needs of today’s economy. Streamlining the business licensing process and relaxing professional licensing requirements can significantly boost economic activity. It is crucial that regulations are cost-effective and support, rather than impede, business operations to promote inclusive growth.
Invest in Infrastructure
High-quality infrastructure is essential for fostering a thriving and accessible business environment. Investing in walkable and well-maintained public spaces can attract both businesses and talent. Tackling urban blight and revitalizing downtown D.C. will benefit local businesses while also improving the overall quality of life, making the city more attractive for residents and visitors alike.
Improve Housing Policies
Create a policy environment that incentivizes housing production to increase housing affordability and availability. By rethinking land use practices, streamlining permitting processes, and reducing regulatory impediments, the District can create an abundance of housing to attract new residents and to support a more inclusive and diverse workforce.
Enhance Fiscal Responsibility
Ensure fiscal sustainability by adopting budgeting practices that use public resources efficiently and effectively. Effective program evaluations and reviews can identify areas where spending can be streamlined without compromising services. Improving the value of tax dollars through a well-functioning government will make the city more attractive to businesses, workers, and residents.
Promote Public Safety
Ensure a safe environment for businesses by addressing crime and enhancing public safety measures. Investing in community policing, improving street lighting, and increasing the presence of security personnel can help reduce crime and create a more secure environment for businesses to operate.
By implementing these strategic measures, the District of Columbia can create a thriving business environment that supports economic growth, attracts investment, and enhances the quality of life for all its residents.
Part 1: Economic Activity and Business Performance
Throughout 2023 and the first half of 2024, D.C.’s economy continued to grapple with the impact of increased remote work. While there has been a slight uptick in commuting activity,[1] average monthly office occupancy remains below 50 percent of pre-pandemic levels. The reduced demand for office space has led to higher vacancy rates and substantial discounts on office valuations. During this 18-month period, 21 large office buildings (over 50,000 sq. ft.) were sold at an average discount of 42 percent compared to their 2023 assessed values.[2] These steep discounts pose a fiscal risk for the city, as commercial property is a key contributor to the city’s revenue.
Entrepreneurial activity in D.C., as measured by net new businesses, remains above pre-pandemic levels but is starting to weaken. While D.C. continues to add new businesses, there has been an increase in business closures and a slower growth in new business applications, reflecting increased risk and a lower level of entrepreneurial interest in the city.
The office market
Since the onset of the COVID-19 pandemic, the D.C. office market has faced substantial challenges without much relief in sight. In 2023 and the first half of 2024, office vacancy rates continued to climb citywide and in select submarkets (Figure 1, top pane). The Central Business District (CBD) and the East End, the city’s most office-dense areas, are particularly affected, with vacancy rates nearing 19 percent by mid-July. Availability rates, which includes both vacant space and space with an expiring lease, reached nearly 25 percent—an all-time high for these two submarkets.
Mixed-use neighborhoods like NoMa and Georgetown, which initially fared better during the pandemic by attracting new leases, also saw increasing vacancy rates, signaling a shift from earlier trends. Since 2021, the advantage mixed-use areas once had over office-heavy districts has diminished.[3]
As vacancy rates rose, annual gross office rents stagnated or declined across the District, with Georgetown being the one exception (Figure 1, bottom pane). In 2024, annual office gross rents for the District fell below their 2019 level, even without adjusting for inflation. Despite these rent discounts, demand has not increased, showing that the District’s office market is no longer competitive with neighboring jurisdictions, other metropolitan areas, or alternative work arrangements such as remote work or shared office spaces.
Figure 1 – Annual vacancy rates and gross rents, 2019 through mid-July 2024
In 2023, the District’s office market had a negative net absorption of roughly 1.5 million square feet, meaning more space has been vacated than leased across the city (Figure 2). Net absorption has remained negative for the first seven and a half months of 2024. The impact has been particularly heavy in the CBD and the East End, both of which experienced continuous negative absorption since the second quarter of 2020 and collectively lost leases for over 31.2 million square feet of office space, which is the equivalent of about 30 percent of total office inventory across these two submarkets.[4]
Figure 2 – Net absorption of office space, 2019 through mid-July 2024
Job activity
The rise of remote work transformed working patterns across the D.C. region. In 2019, nearly 7 in 10 people who worked in D.C. lived outside the city, making the city’s economy heavily reliant on commuter activity. Now, many of these commuters can and do work from home, affecting the service economy, public transportation, and office values.[5]
The Bureau of Labor Statistics reports workers by the location of their employer, which overstates the activity in D.C. when workers are working from home elsewhere in the region. The D.C. Policy Center’s “job activity” metric adjusts employment statistics to reflect where workers are actually working.[6] Since the pandemic, job activity has shifted from D.C. to elsewhere in the Washington metropolitan area.
In 2019, the District accounted for 30 percent of the Washington metropolitan area’s job activity in management, business and financial occupations. In 2021, that share had declined by 9 percentage points to 21 percent (Figure 3). Although the District regained 2 percentage points in 2022, its share remained below 2019 levels. A similar pattern emerged for computer, engineering, and science occupations, as well as office and administrative support roles. Meanwhile, the city continued to lose its share in healthcare occupations—a disconcerting trend given that the healthcare sector includes some of the largest employers in the city.[7]
Figure 3 – District’s share of job activity in the Washington metropolitan area, 2019 through 2022
Entrepreneurial activity
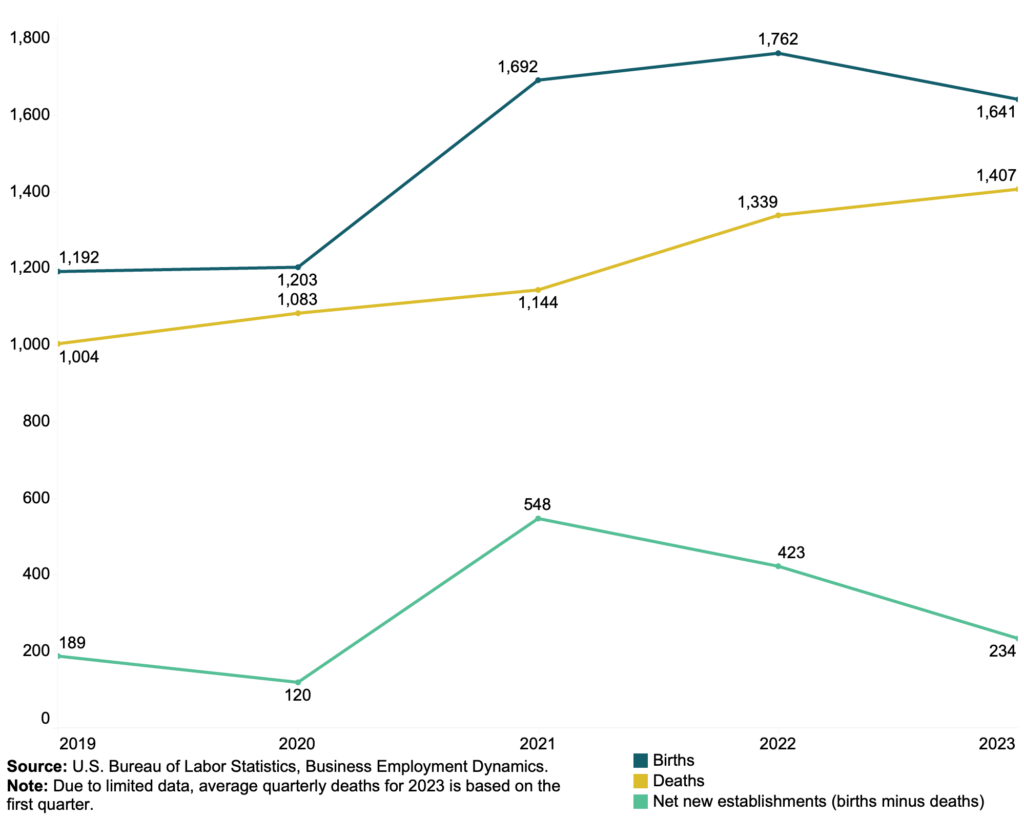
Entrepreneurial activity, measured by net new businesses, is higher than pre-COVID levels, but recent data on business formation—applications, births, and deaths—raise concerns. In 2021, the number of net new establishments peaked at an average of 423 per quarter. However, between 2021 and 2023, this average quarterly number dropped to 234, a decline of 56 percent, driven primarily by increased business closures (Figure 4).
Figure 4 – Business establishment births, deaths, and net new business creation, 2019 through 2023
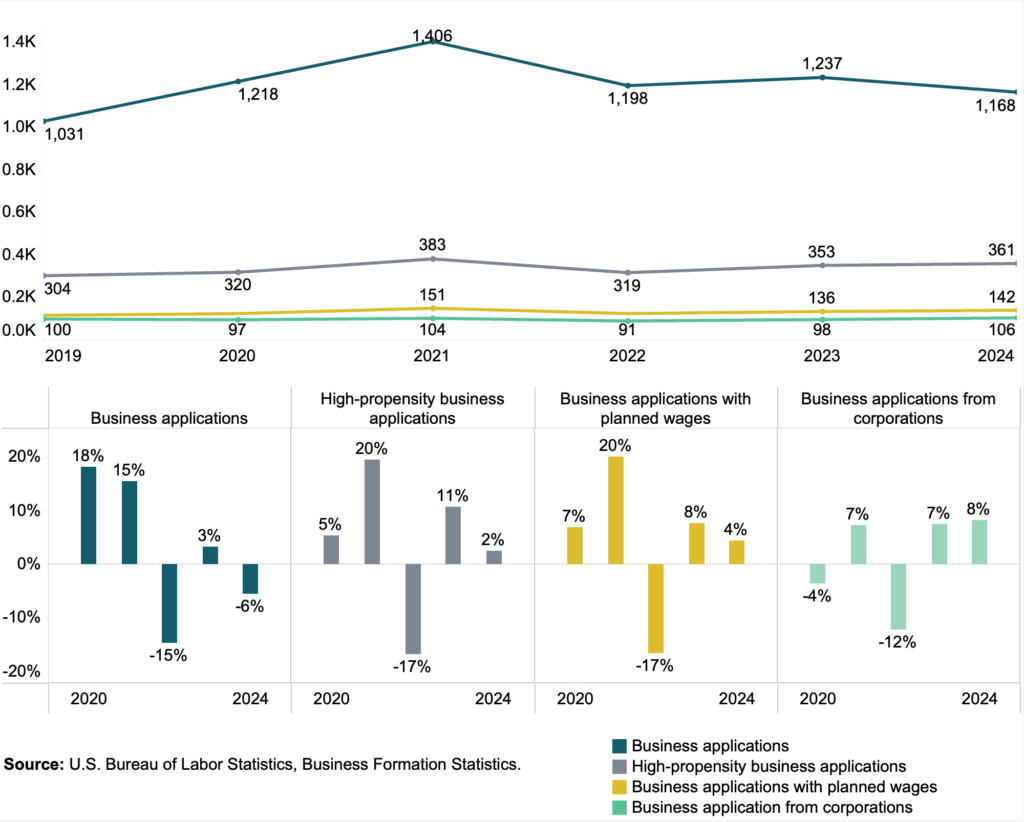
Business application shows similar signs of weakening (Figure 5). In 2021, the average number of business applications per month reached a high of 1,406. By 2022, this number fell to 1,198, a 15 percent decrease. By June 2024, the average number of business applications per month declined by nearly 17 percent since its 2021 peak. On the positive side, high propensity business applications—those that are more likely to turn into wage-paying establishments within two years of their formation—remain above pre-pandemic levels at an average of 361 per month.
Figure 5 – Business applications, by type of application, 2019 through June 2024
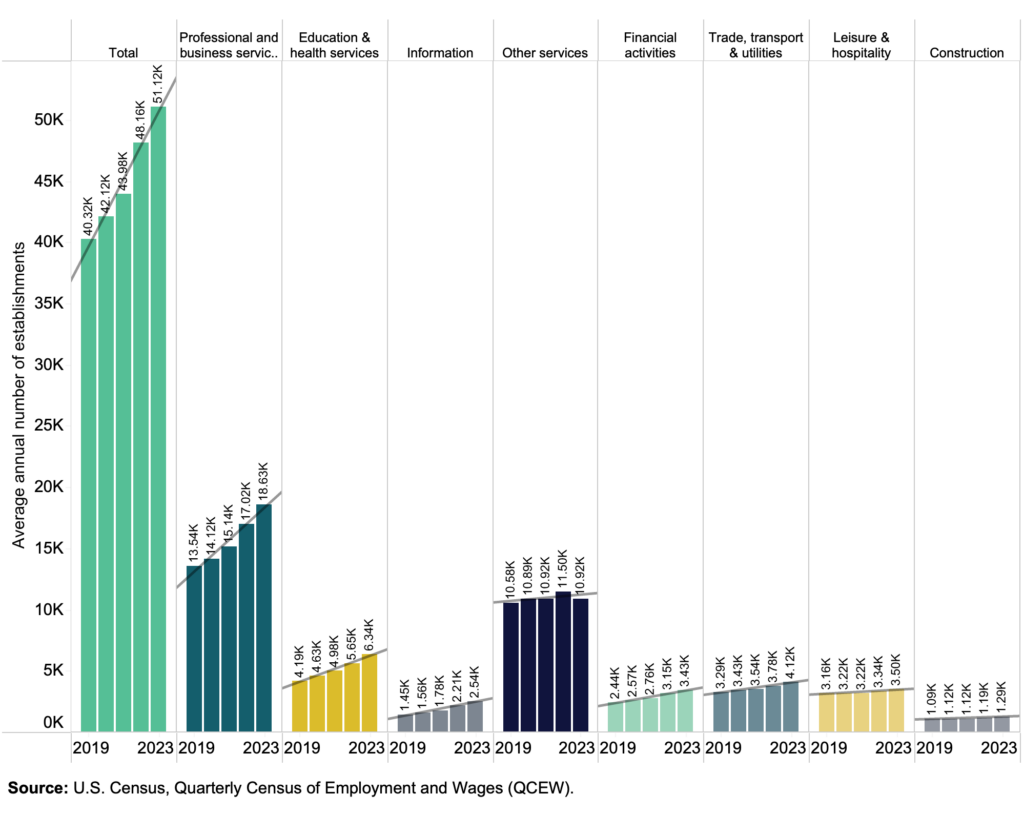
The data indicate that about one in five new business applications turn into actual businesses. Between 2022 and 2023, the average annual number of establishments in the District grew by 6 percent, or from roughly 48,000 to 51,000 (Figure 6).
Entrepreneurial activity, measured by net new businesses, remains higher than pre-COVID levels, but recent data on business formation, closures, and applications reveal concerning trends. In 2021, net new establishments peaked at an average of 423 per quarter. However, from 2021 to 2023, this quarterly average dropped by 304, a decline of 56 percent (Figure 4), driven primarily by an increase in business closures.
Business application data shows similar signs of weakening (Figure 5). In 2021, the average number of business applications per month reached a high of 1,406. By 2022, this number fell to 1,198, a 15 percent decrease. As of 2024, covering the first six months of the year, monthly business applications had dropped by nearly 17 percent since the 2021 peak. On a positive note, high-propensity business applications—those more likely to become wage-paying employers within two years—remain above pre-pandemic levels, averaging 361 per month.
Despite these declines, approximately one in five new business applications result in actual business formations. Between 2022 and 2023, the total number of establishments in the District grew by 6 percent, rising from around 48,000 to 51,000 (Figure 6). This trend is a promising sign, as the growth rate in 2022 and 2023—9.5 percent and 6.2 percent, respectively—surpassed the increases seen in 2020 and 2021, when establishment growth remained below 5 percent each year.
Figure 6 – Total establishments by sector, 2019 through 2023
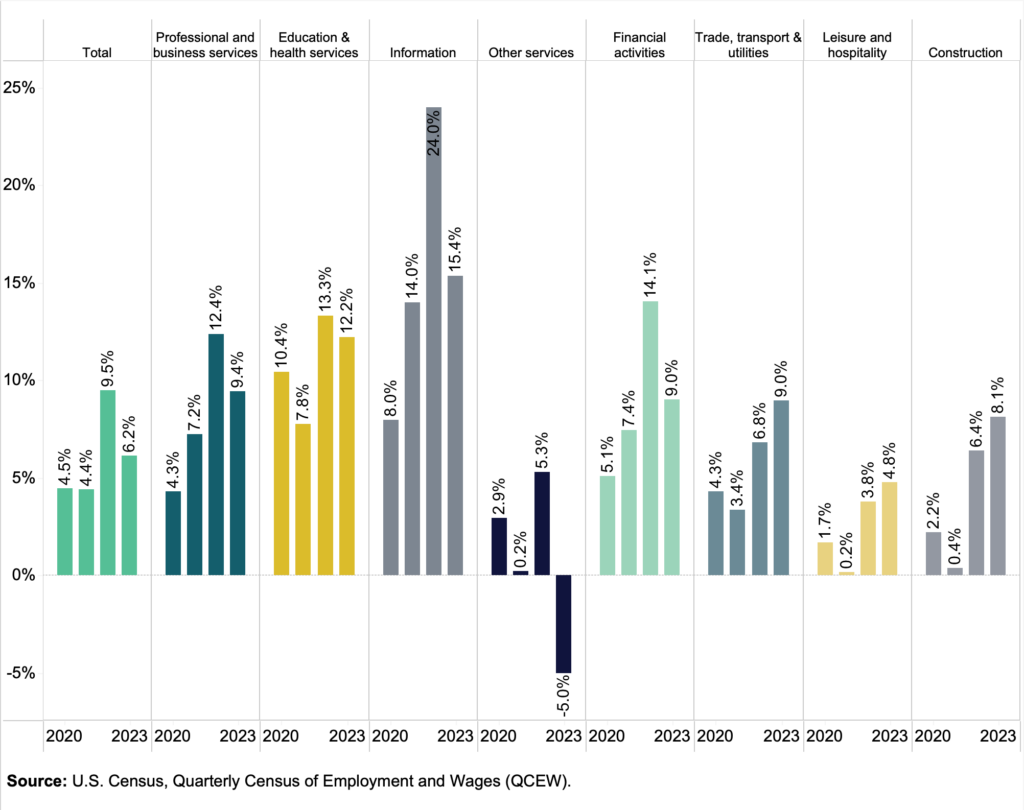
Notably, the number of establishments in “Other services”—which includes personal and repair services—declined by 5 percent between 2022 and 2023 (Figure 7). This sector was the only one to experience a decline in establishments in the four-year period shown. The decline reflects the shift of job activity away from the District to the District’s suburbs and exurbs as the service sector typically follows residents.
Figure 7 – Annual establishment growth by sector, 2019 through 2023
Part 2: Employment and jobs
D.C.’s employment landscape has shown resilience as resident employment has recovered from the shock of the COVID-19 pandemic. However, overall job growth in the city has been lackluster. Total nonfarm employment remains below its pre-pandemic level in all sectors, except for professional and business services. Despite job openings being above pre-pandemic levels, both official data and the D.C. Policy Center Business Sentiments survey indicate that hiring is slowing down. Survey participants attribute this slowdown to pessimistic expectations about the future of D.C.’s economy and the increased challenges in hiring and retaining workers.
Resident employment, unemployment, labor force participation
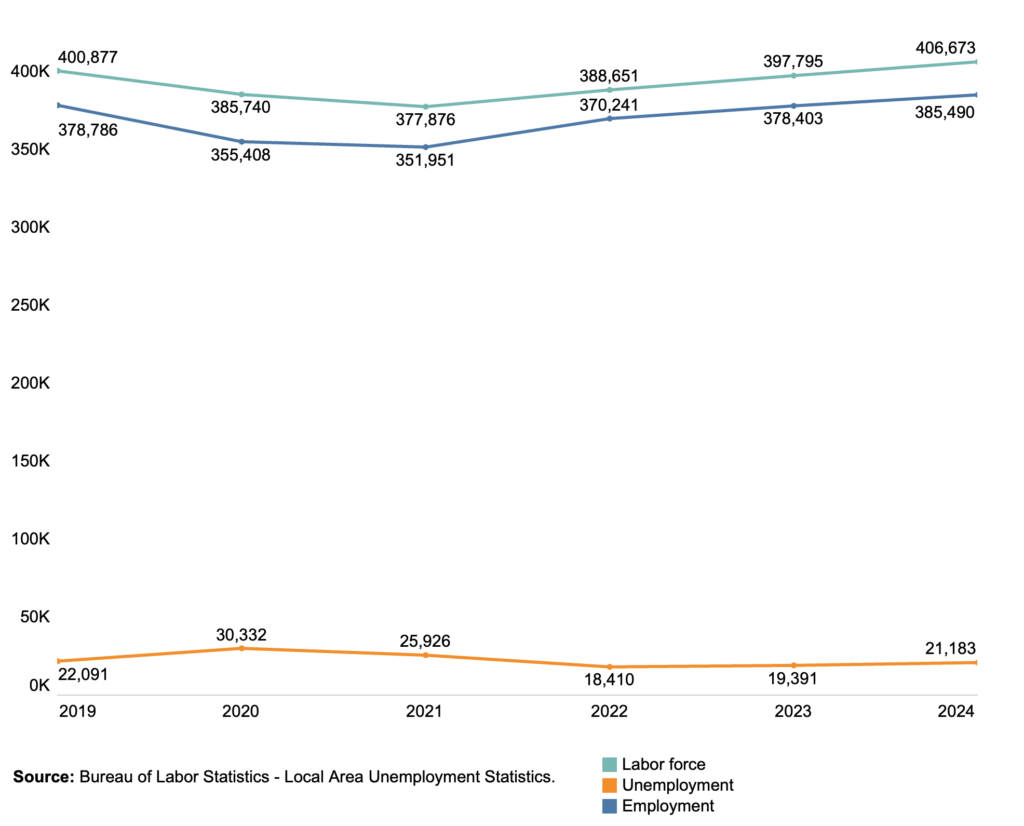
In the first six months of 2024, resident employment in D.C. (all employed D.C. residents regardless of their work location) reached 385,490, which is 1.8 percent above its 2019 level of 378,786 (Figure 8). The resident labor force (residents who are employed or looking for work) also exceeded its 2019 level, reaching 406,673. This represents a 1.4 percent growth in the city’s resident labor force from 2019 through June 2024.
Figure 8 – D.C.’s labor force, employment, and unemployment, January 2019 through June 2024
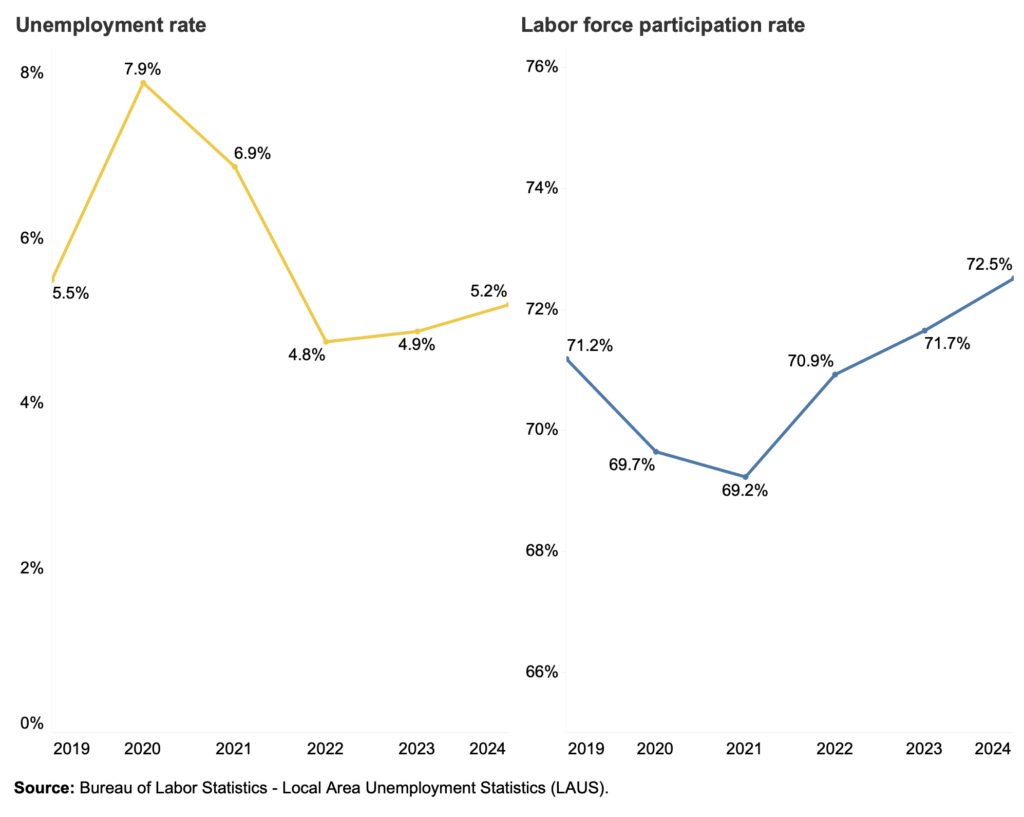
With resident employment growing slightly faster than the resident labor force, the resident unemployment rate declined by 0.3 percentage points—from 5.5 percent in 2019 to 5.2 percent through June of 2024 (Figure 9). During the same period, the labor force participation rate increased from 71.2 percent to 72.5 percent.
It is important to note that, since the beginning of the pandemic, employment, resident labor force, and labor force participation followed different trajectories. Employment and labor force participation reached their respective low points in 2021 and have been gradually recovering since then. The resident unemployment rate continued its decline through 2022, and since then increased from 4.8 percent to 5.2 percent through June of 2024. This increase in the unemployment rate is due to more people entering the job market and actively seeking work.
Figure 9 – Unemployment rate and labor force participation rate, January 2019 through June 2024
Overall, D.C.’s resident employment trends show positive signs of recovery and growth, with a strong resident labor force and increasing participation rates. By addressing the challenges in hiring and retention, the city can continue to build on these gains and foster a robust economic environment.
Employment in the city
Despite resident employment having recovered from the economic shock of COVID-19, nonfarm employment—which includes all workers working for a D.C.-based establishment, regardless of where they live—remains below its 2019 level. In 2019, nonfarm employment stood at approximately 793,300. For the first six months of 2024, nonfarm employment remained 2.9 percent below its 2019 level, at 770,300 (Figure 10). [8]
The sluggish job recovery from the COVID-19 pandemic contrasts with the District’s performance after the 2008 financial crisis. Between 2008 and 2012, the District’s total nonfarm employment grew by nearly 6 percent, while national nonfarm employment shrank by 2.5 percent. But in the post-COVID era, national nonfarm employment has outperformed the District.[9] Between January 2020 and June 2024, national nonfarm employment grew by 4.4 percent, while D.C. nonfarm employment contracted by 4.1 percent.
Figure 10 – Total nonfarm employment, and employment in key sectors, January 2019 through June 2024
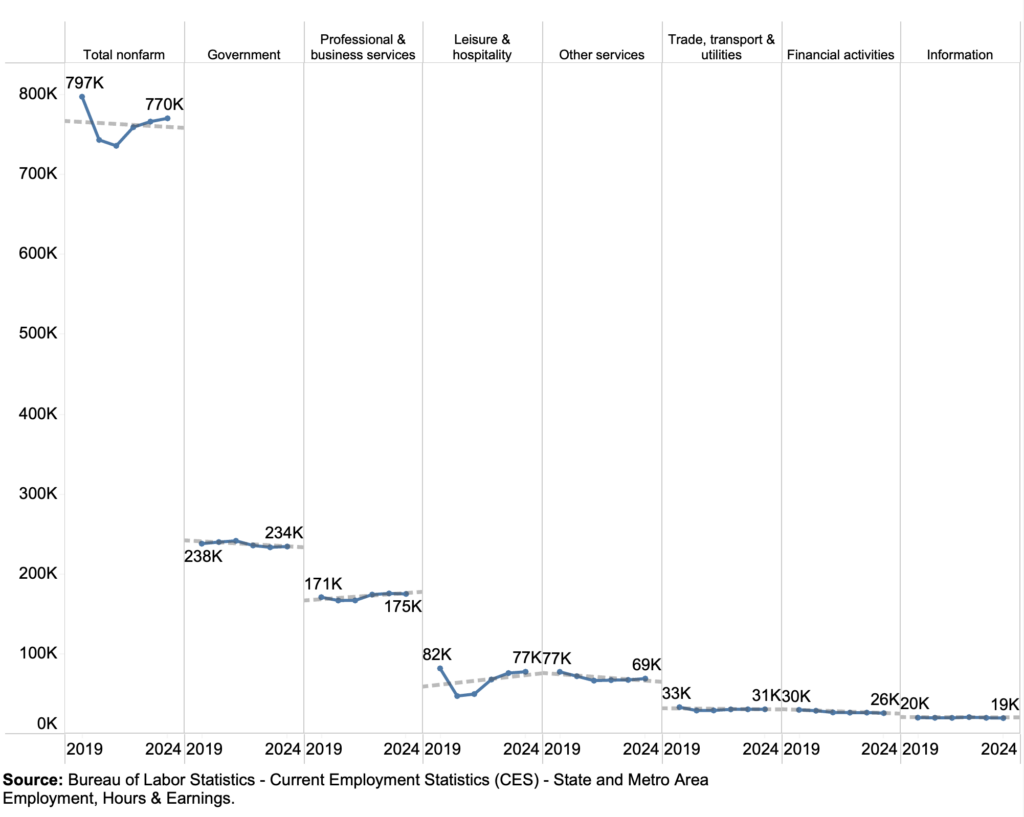
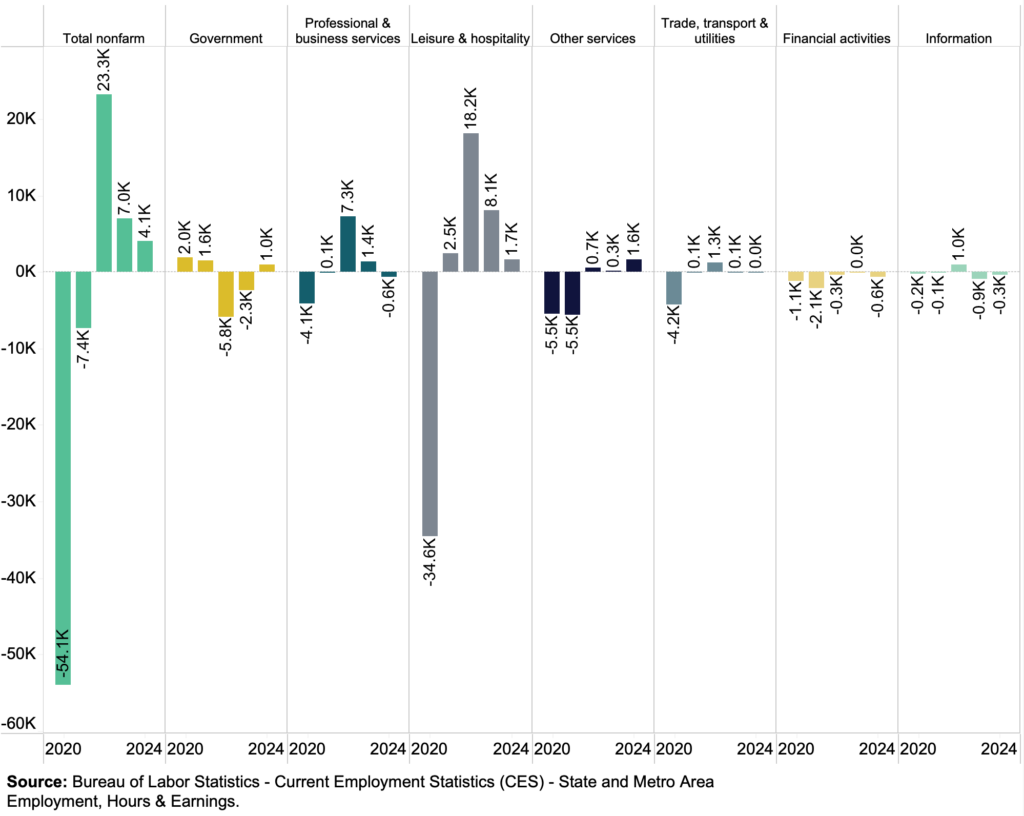
Across all sectors of the District’s economy, only the business and professional services sector has exceeded its 2019 level of employment. Other sectors—such as government, leisure and hospitality, information, and financial activities—remain below their pre-pandemic levels. Importantly, employment trends have weakened over the past two years (Figure 11). Even in the business and professional services sector—traditionally the key driver of job growth in the District—employment grew by 1,400 in 2023 but declined by 600 jobs in the first six months of 2024. [10]
Figure 11 – Year to year job gains or losses, January 2019 through June 2024
Job openings and turnover
Since the beginning of the pandemic, employers have struggled to fill open positions. The gap between job openings and net new hires (hires minus separations) was around 4.5 percent of total employment in May 2024, which is substantially greater than it was before the pandemic (3.2 percent of employment in January 2020). But this gap was at 5.3 percent at the end of 2022 and has continuously narrowed through 2023 and the first half of 2024, indicating progress despite ongoing hiring challenges (Figure 12).[11]
Figure 12 – Job openings, hires, and net new hires, January 2019 through May 2024

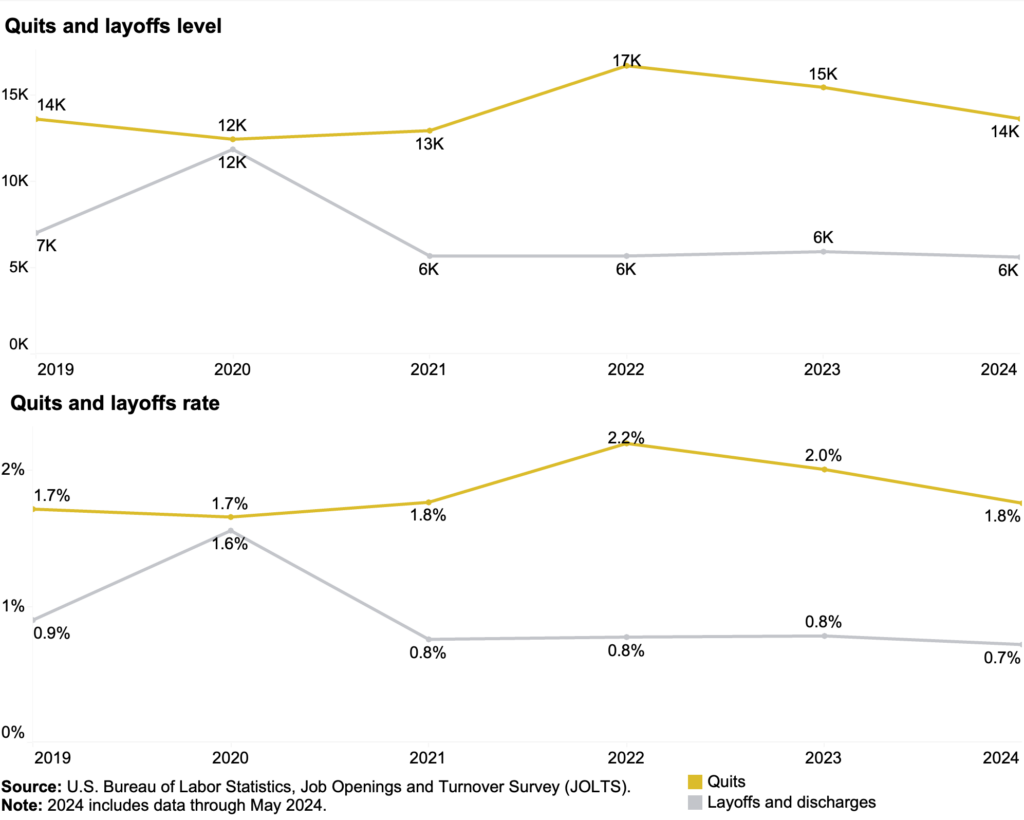
In the pandemic’s aftermath, especially in 2022, the District saw an increase in the number of workers quitting their jobs. This trend likely indicated either employee dissatisfaction or increased confidence that better employment opportunities were available elsewhere (including through remote work).[12] But in the last two years, the number of quits declined from roughly 17 thousand (2.2 percent of total employment) to 14 thousand (1.8 percent of total employment). This decline may signal reduced decreased confidence among workers about their job market prospects or expectations of an economic downturn (Figure 13). [13]
Figure 13 – Quits and layoffs, January 2019 through May 2024
The results from the D.C. Policy Center’s Quarterly Business Sentiments survey, conducted throughout 2024 align with trends in employment and hiring as seen in publicly available official data. For instance, two-thirds of respondents indicated that they did not expect any changes in their employee numbers over the next six months, and 38 percent expected the D.C. economy to be “somewhat” or “much” weaker.[14] The D.C. Policy Center’s Quarterly Business Sentiments survey has also found that many businesses believe it has become more challenging to hire or retain workers since the beginning of the pandemic, with local taxes and labor laws exacerbating these difficulties.[15]
Part 3: Business sentiments
With the loss of substantial commuter activity, District businesses had to adapt and innovate, bringing a renewed vibrancy to the city. Despite economic uncertainties and tempered future expectations, many businesses remain resilient and cautious, taking careful steps as they plan. Key post-pandemic concerns for D.C. businesses include crime, the regulatory and tax environment, and difficulties in hiring and retaining employees.[16]
Uncertainties about the District’s fiscal future is also a significant concern but can hold potential for positive transformation. The approved fiscal year 2025 budget relies on $402 million in new tax revenue, including $322 million from a payroll tax initially intended to support paid family leave benefits.[17] Additionally, the city plans to use $849 million from past savings to balance the budget. Over the four-year financial plan covering fiscal years 2025 through 2028, the city’s recurring revenue, which includes the revenue from new taxes, will not be sufficient to cover current expenditures, depleting $2.3 billion of past savings. Uncertainties about revenue growth and commercial property valuations add to the fiscal risks, raising concerns about future tax increases. But, in preparation for this difficult fiscal future the city leaders invested in budget and program evaluations in fiscal year 2025, taking an important step towards more effective and efficient budgeting.
Business expectations
While business expectations about demand have remained stable since early 2023,[18] D.C. businesses are becoming more pessimistic about their performance. In early 2023, 49 percent of businesses rated their performance as “average” or “below average.” In early 2024, this number had climbed to 52 percent. By the summer of 2024, 64 percent of D.C. businesses described their performance as “average” or “below average,” which represents a 15-percentage point increase in the past year and a half (Figure 14).
Figure 14 – Changes in businesses’ perception of their own performance, early 2023 through summer 2024
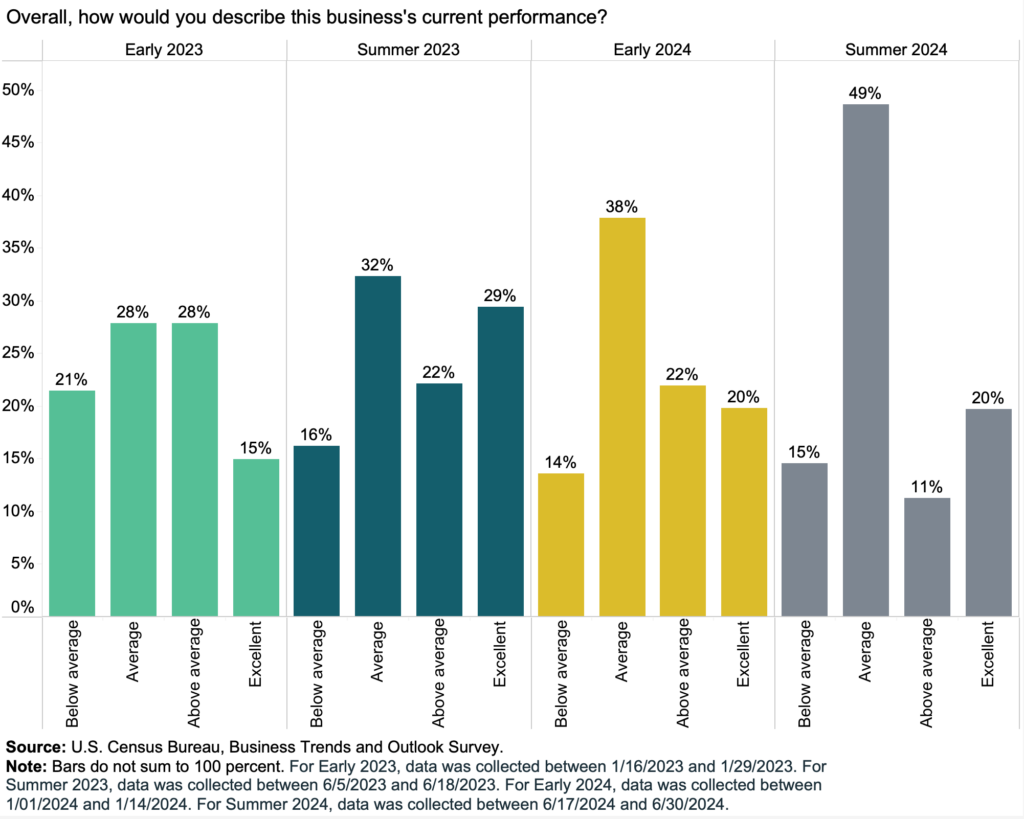
Figure 15 – Six-month expectations of economic performance of national, regional, and D.C. economy
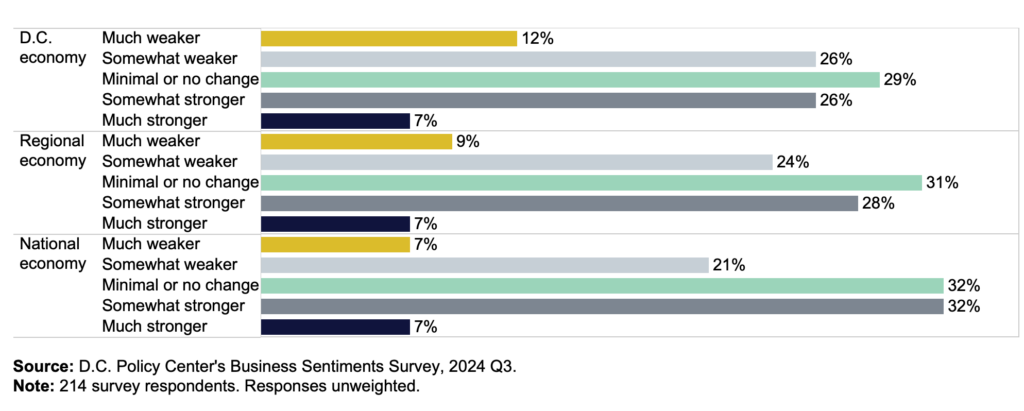
This shift in self-assessment is primarily driven by concerns about D.C.’s local economy rather than the national economy. anticipated that the D.C. economy would be somewhat or much weaker in the next six months, but only 28 percent of respondents had the same expectation for the national economy. This outlook may be due to D.C.’s economic underperformance relative to the national economy since the COVID-19 pandemic (Figure 15). This contrasts with the pre-pandemic years when the city consistently outperformed both the regional and the national economies.[19]
Business priorities and concerns
Survey evidence indicates that crime was an immediate concern for many businesses in 2023, and that local tax rates and regulations have become increasingly important since the pandemic. Businesses also report greater difficulty in retaining or hiring employees. When choosing locations, businesses prioritize locations with vibrant business activity, absence of blight, high-quality infrastructure, and accessibility through public transportation.
Crime
Figure 16 – Frequency of crimes experienced in the business place in 2023
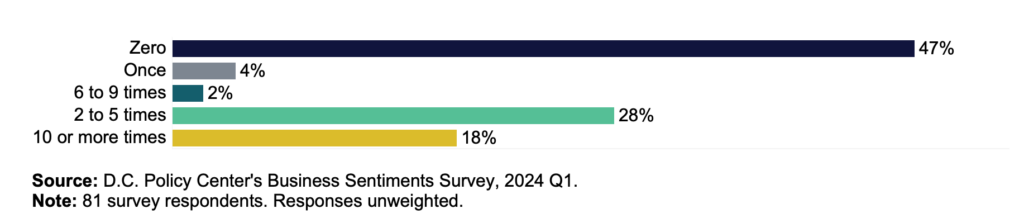
Last year, crime was a key concern for many businesses in the D.C. region. The D.C. Policy Center’s Business Sentiments Survey revealed that nearly half of the respondents indicated that the businesses they were affiliated with had experienced two or more crime incidents in 2023 (Figure 16). While the media often focused on homicides, disruptive behavior and property damage were the two most common crimes reported by survey respondents. Nevertheless, these lower-level crimes unduly burden businesses: 89 percent of respondents reported spending more on security measures, including installing security cameras and hiring more security personnel. These are costs they would not have had to incur, or incur as heavily, with better public safety.[20]
Local taxes and regulations
Figure 17 – Change in the importance of business location factors before and after the pandemic
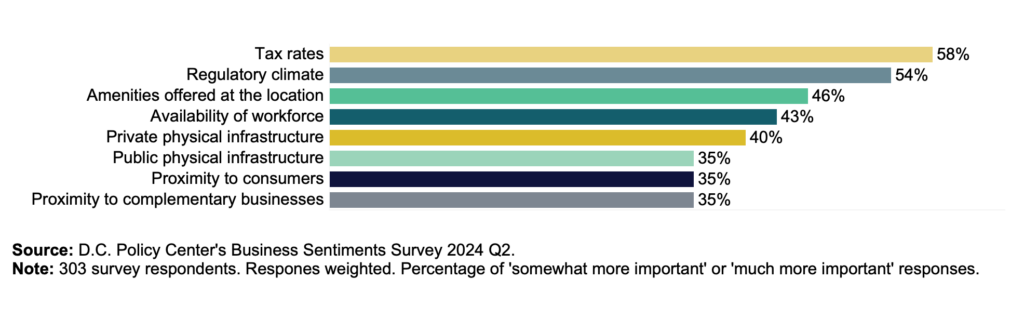
Since the COVID-19 pandemic, tax rates and the regulatory regimes of regional jurisdictions have become a more important consideration in business location decisions, as revealed by the second round of the D.C. Policy Center’s Business Sentiments Survey (Figure 17). Given that D.C. already levies relatively high taxes on businesses and imposes greater regulatory burdens compared to many other jurisdictions in the region, this feedback underscores the importance of thoughtful tax and regulatory policies to remain competitive and attractive to businesses.[21]
Vibrancy, lack of blight, accessibility
Figure 18 – Physical infrastructure most valued by businesses
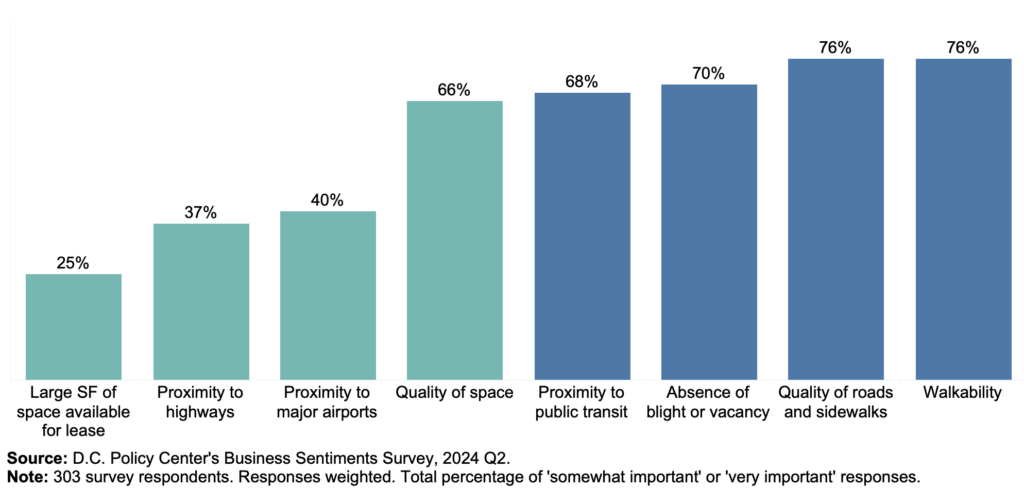
Businesses also report they value the appearance and accessibility of the city. In April 2024, survey respondents to the Business Sentiments Survey ranked being close to public transportation, walkability, and well-maintained sidewalks as top business location considerations (Figure 18). Additionally, respondents also considered the absence of blight or vacancy to be quite important. It is worth noting that these considerations are intimately related to and affected by the quality of services provided by the city.[22]
Hiring and retention
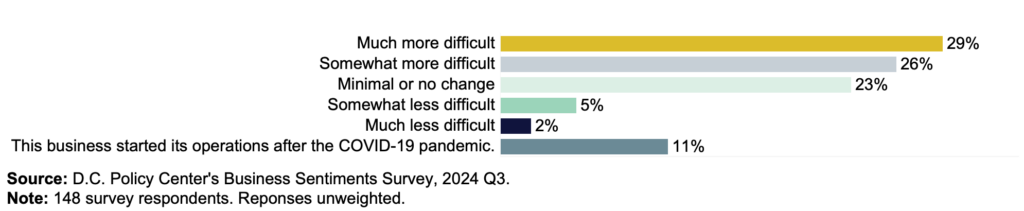
Since the COVID-19 pandemic, businesses have confronted greater challenges in hiring or retaining employees. 55 percent of round-three survey respondents reported that hiring or retaining employees has become “somewhat” or “much more” difficult (Figure 19). Meanwhile, 23 percent of respondents reported minimal or no change. Only 7 percent reported that retaining or hiring employees has become somewhat or much less difficult.[23]
Figure 19 – Ease/difficulty in hiring and retaining employees compared to before the pandemic
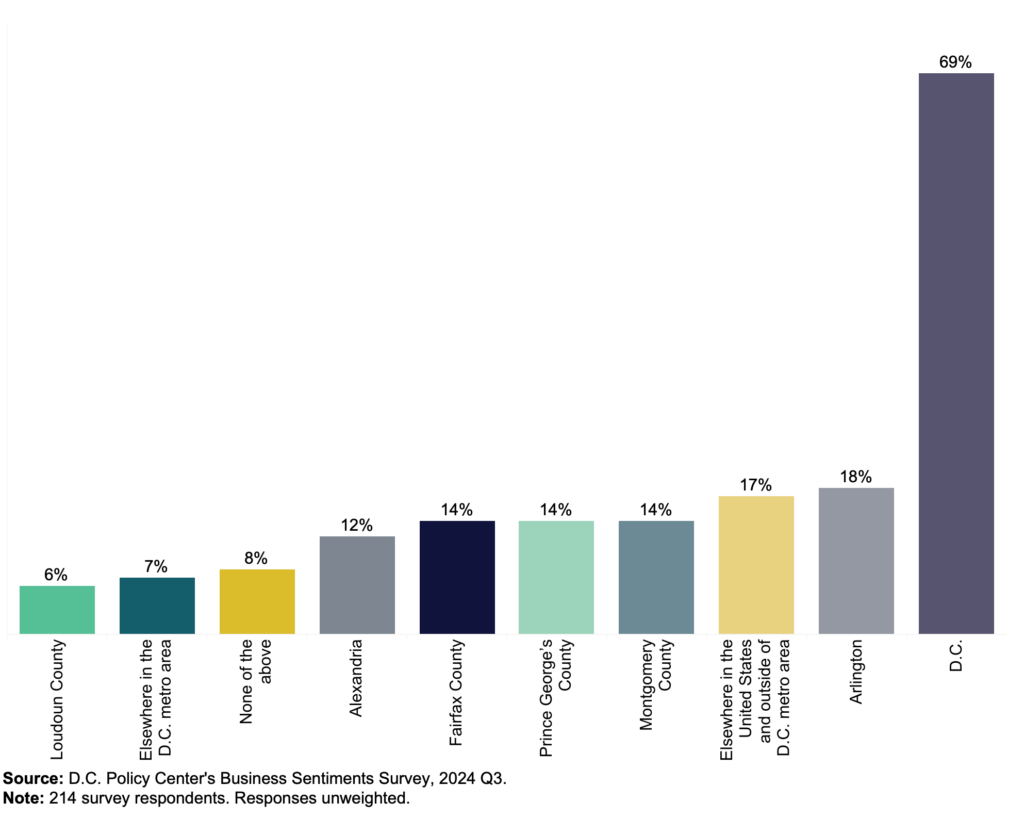
Even in the face of the various uncertainties and concerns, there are encouraging signs. Nearly 70 percent of July 2024 Business Sentiments Survey respondents seem enthusiastic about investing in the city (Figure 20). Investment interest in the city was almost four times that of Arlington County—which garnered the second most interest after the District itself. More generally, the continued interest in the city suggests that a future of strong growth and economic vibrancy remains within reach.[24]
Figure 20 – Places of investment interest in the Washington metropolitan area
Part 4: Creating an environment for business success
The last few years have shown that the District’s businesses are resilient, and the city remains attractive for new entrepreneurs. But given economic conditions, weakening demand for D.C., and increased uncertainty, the District government can take important steps to create a business climate that is welcoming for new businesses and conducive to economic growth.
In this evolving environment, the city has a chance to reduce unnecessary burdens on businesses. By adopting budgeting practices that ensure funds are spent effectively, the city can deliver essential services without added tax burdens. The review and removal of regulations that do not clearly contribute to entrepreneurial success and job creation can also stimulate economic growth. These pro-growth policies will generate much-needed dividends that can be reinvested into the city, fostering a thriving environment for all.
Get the District’s fiscal house in order
In the upcoming years, the District will face a challenging fiscal environment. The adopted budget for fiscal year 2025 relies on $849 million dollars of one-time funds and $402 million dollars in new revenue. However, throughout the four-year financial period from fiscal years 2025 through 2028 recurring expenditures consistently outpace reoccurring revenues, depleting the city’s past savings by $2.3 billion.
Adding to the fiscal uncertainty are concerns around commercial property values. Recent sales indicate that valuations are down by nearly half from their 2021 highs but assessed values (and therefore tax bills) show a much smaller decline. If assessed values decline by more than what is projected, it could create a significant shortfall in next year’s budget, further straining the city’s fiscal future.
The District has a four-year window to enhance its fiscal outlook. One way to get there is to ensure that public dollars are spent efficiently so that more can be done with less. Incorporating program evaluations into the budget process would constitute an important step toward achieving this goal. These evaluations can pinpoint areas where the District can streamline its spending without negatively affecting the city’s most vulnerable residents. By prioritizing evaluations of high-cost programs that have yet to demonstrate effectiveness, the District can ensure that resources are used efficiently and effectively, fostering a stronger and more sustainable fiscal future.[25]
Invest in Downtown D.C.
Investing in high-quality infrastructure and addressing urban blight can create a more vibrant and accessible environment, support existing businesses, attract new ones, and encourage employee retention. Ensuring the District—and especially downtown D.C.—is an attractive place for people to live and work will be crucial for fostering business success. Policies aimed at revitalizing downtown D.C. will not only benefit the downtown area but the entire city. A thriving downtown will generate revenue, improving the city’s fiscal outlook. With a strong financial foundation, the District government can invest more effectively in better and higher-quality city services, enhancing the overall quality of life for all residents.[26]
Modernize the District’s regulatory environment
It is important that the District regularly review its business regulations to ensure that they are not unduly burdensome and truly meet a need in a cost-effective manner. Well-designed regulations can foster economic opportunity and support the growth of new businesses. The District has already taken some positive steps by simplifying the business licensing process and modifying the “Clean Hands” threshold in the fiscal year 2025 budget. These actions will expand the pool of D.C. residents who can start their own business and add to the city’s tax base and employment.[27] There are many other opportunities for reform, from professional licensing to environmental regulations where small changes can lead to big positive economic impacts without creating harm. The District must reassess its regulatory priorities to ensure that regulations that inhibit business activity without commensurate public benefits are either reformed or removed.
Make it easier to build new housing
Remote work has broken the relationship between where people work and where they live.[28] In the past, many residents moved into the District for jobs, and then moved out for housing.[29] With this relationship broken, housing policy is arguably the District’s most important economic development policy.[30] While the District has made significant investments in affordable housing, the city’s strict land use regulations, unpredictable permitting practices, and various regulatory impediments make the city less attractive to investors. This limits the stock of naturally occurring affordable housing, which is necessary to create an inclusive city.
To unleash growth, the District must become a more competitive, compelling city for investors, businesses, workers, and residents. This means rethinking land use practices to expand housing, easing regulatory burdens to increase innovation, and doubling down on core municipal functions to make communities safer and the city more attractive to families. D.C. must become a city with an abundance of housing, an abundance of good-paying jobs, an abundance of safe neighborhoods with an abundance of amenities, an abundance of affordable childcare, and an abundance of good schools. By addressing these areas, the city can foster a business-friendly environment that supports economic growth and stability.
[1] Data from Kastle shows that the share of workers swiping their access cards increased by 4.7 percentage points between January 2023 and June 2024.
[2] Costar sales data for large office buildings between January 1, 2023, and June 30, 2024. This number excludes buildings.
[3] Daniel Burge, “Chart of the week: Mixed-use neighborhoods have not been spared from a rising office vacancy rate,” D.C. Policy Center, June 14, 2024; Bailey McConnell, “Is mixed-use the future of downtown D.C.?” D.C. Policy Center, November 23, 2021.
[4] Costar data for CBD and East End.
[5] Bailey McConnell and Yesim Sayin, “Remote work and the future of D.C. (Part 1): How is remote work changing the geography of work in the District of Columbia?” D.C. Policy Center, May 12, 2022; Bailey McConnell and Yesim Sayin, “2023 State of Business Report: Doing Business Under Fiscal Distress,” D.C. Policy Center, September 28, 2023.
[6] Yesim Sayin and Bailey McConnell, “Worker sprawl in the Washington metropolitan area: Is D.C. still the region’s job hub?” D.C. Policy Center, May 1, 2023.
[7] According to the District’s 2023 Annual Comprehensive Financial Report six of the largest 15 employers in the city are hospitals or healthcare providers.
[8] This figure is the monthly employment averaged over the first six months of 2024.
[9] Daniel Burge, “Chart of the week: Since January 2023, D.C. has lagged the nation in total private and total nonfarm job growth,” D.C. Policy Center, May 3rd, 2024.
[10] Daniel Burge, “Chart of the week: Employment growth in traditionally important D.C. sectors has been weak,” D.C. Policy Center, January 4th, 2024.
[11] Yesim Sayin and Bailey McConnell, “2023 State of Business Report: Doing Business Under Fiscal Distress,” D.C. Policy Center, September 28, 2023
[12] Kim Parker and Jliana Menasce Horowitz, “Majority of workers who quit a job in 2021 cite low pay, no opportunities for advancement, feeling disrespected.” Pew Research Center, March 9, 2022.
[13] Austen Hufford, “Job Quitting Fell 12% Last Year—and That’s Bad News for the Economy.” The Wall Street Journal, January 30, 2024.
[14] Daniel Burge, “Business Sentiments Survey 2024 Quarter 2 results,” D.C. Policy Center, July 1, 2024.
[15] The survey was conducted between July 15 2024 and August 1, 2024.
[16] D.C Policy Center Business Sentiments Survey.
[17] Fiscal Year 2025 Approved Budget.
[18] According to the U.S. Census Bureau’s Business Trends and Outlooks survey, in early 2023, 52 percent of D.C. businesses expected no change in demand, and in early 2024, the number increased by one percentage point. By the summer of 2024, 56 percent of D.C. businesses expected “no change” in the demand for goods or services over the next half year.
[19] The sentiments expressed by survey respondents may not be representative of the D.C. region’s business community. The results reported here for 2024 Q3 are unweighted.
[20] Daniel Burge, “Business Sentiments Survey 2024 Quarter 1 results” D.C. Policy Center, April 8, 2024.
[21] Daniel Burge, “Business Sentiments Survey 2024 Quarter 2 results” D.C. Policy Center, July 1, 2024.
[22] Daniel Burge, “Business Sentiments Survey 2024 Quarter 2 results” D.C. Policy Center, July 1, 2024.
[23] D.C Policy Center Business Sentiments Survey.
[24] D.C Policy Center Business Sentiments Survey.
[25] Yesim Sayin and Daniel Burge, “Laying the foundation for a resilient fiscal future for the District of Columbia,” D.C. Policy Center, April 25, 2024.
[26] Yesim Sayin, “The future of Downtown and the future of D.C. are inseparable,” D.C. Policy Center, January 9th, 2024.
[27] Emilia Calma, “Optimizing the clean hands requirement for improved economic opportunity in D.C.” D.C. Policy Center, June 20, 2024.
[28] Bailey McConnell and Yesim Sayin (2022) “Remote work and the future of D.C. (Part 1): How is remote work changing the geography of work in the District of Columbia?” D.C. Policy Center, May 12, 2022.
[29] Yesim Sayin, “Residents move into the city for jobs, move out for housing.” District Measured 2015.
[30] Andrew Trueblood, “Housing for workforce is a key economic development program.” D.C. Policy Center, July 31, 2024.