Various calculations, surveys, and reports frequently place D.C. among the top 10 healthiest cities in the nation, in no small part due to the high rate of physical activity among its residents. Using data from the 500 Cities Project, which collects local data in an effort to improve health in the 500 largest cities in the U.S., I found that D.C. is the ninth most active city in the U.S. In fact, only one in five adults ages 18 and older in the District—20.5 percent—say they do not engage in any leisure-time physical activity.
Fitness facilities and physical activity in D.C.
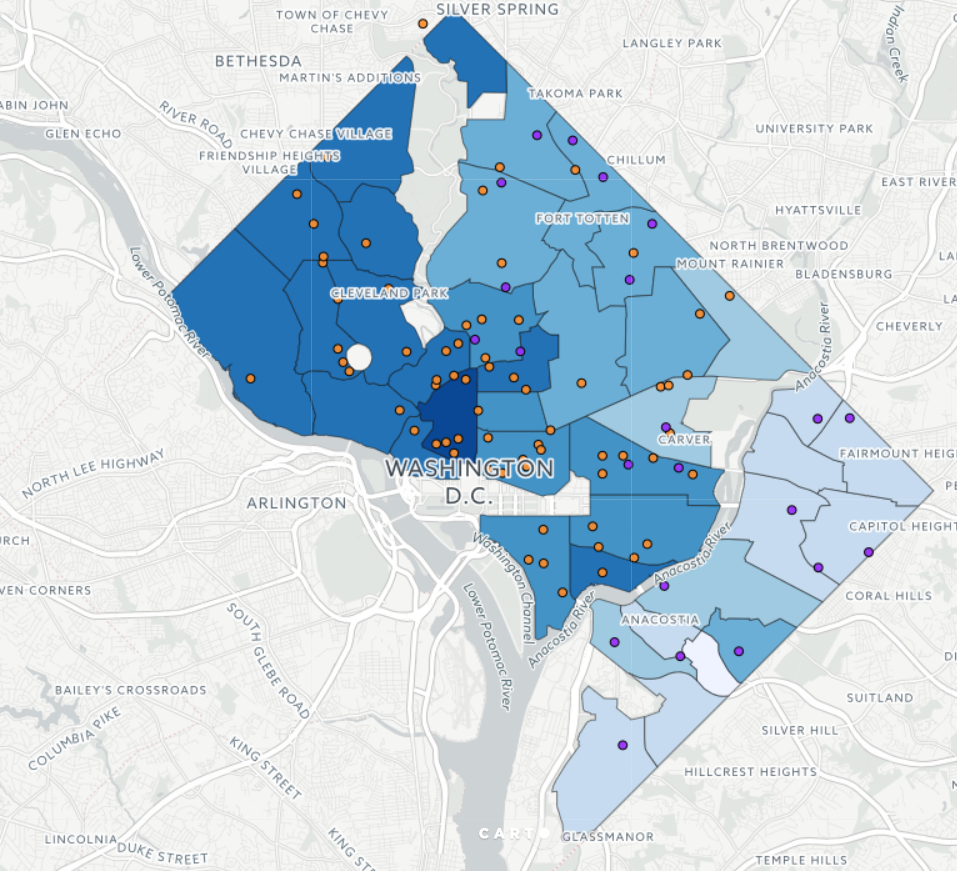
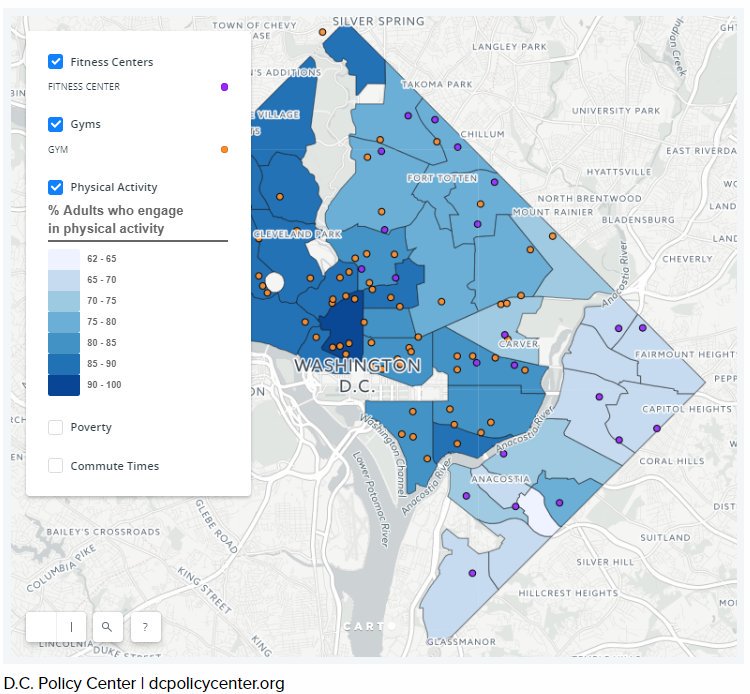
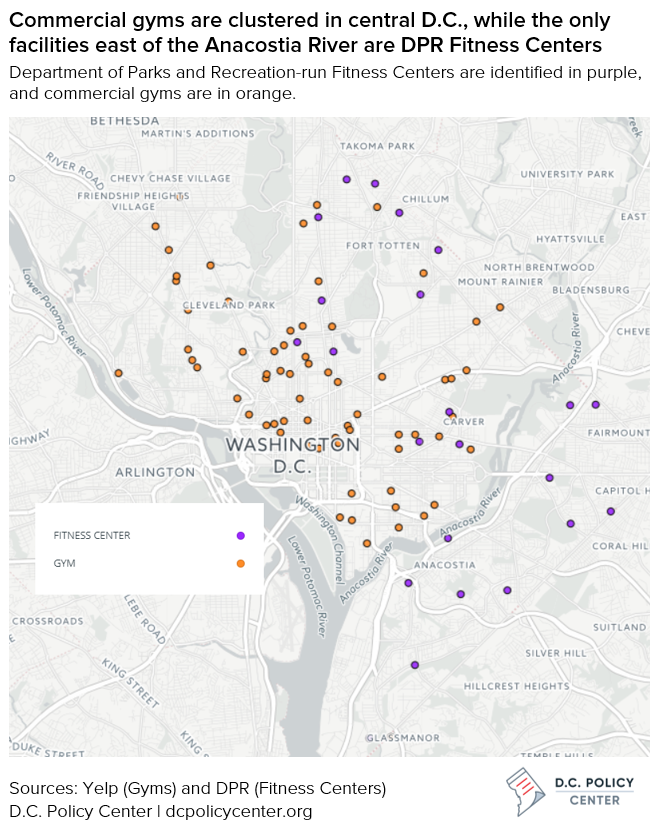
In the map below, I aggregated the data to neighborhood clusters to display percentage of adults who don’t exercise in each neighborhood. Fitness Centers run by the Department of Parks and Recreation are identified in purple, and commercial gyms are in orange.
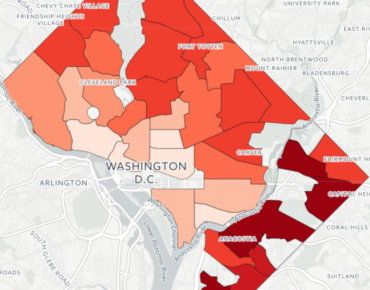
For the most part, every neighborhood cluster West of Rock Creek Park reports fewer than 15 percent of residents do not engage in leisure-time physical activity. Southwest, Navy Yard, and Capitol Hill are all within the 10-20 percent range. Exercise rates are somewhat lower for most neighborhoods in Northeast D.C., but the proportion of residents who do not exercise is below 25 percent. Finally, the majority of neighborhoods east of the Anacostia River report that more than a quarter of residents do not exercise, the one exception being the cluster of Fairfax Village, Naylor Gardens, Hillcrest, and Summit Park, at 23.1 percent.
Neighborhood factors that contribute to low levels of physical activity
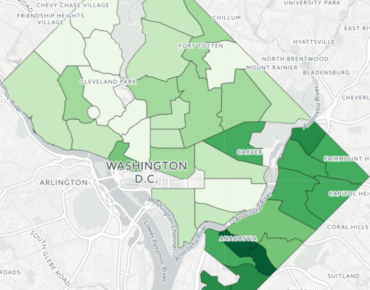
Many factors contribute to the likelihood that someone will exercise regularly. For example, poverty is not only associated with lower levels of physical activity, but also with many other negative health factors, from acute trauma and chronic stress to a lack of fresh food options; it’s also interconnected with obesity and chronic diseases, among other health-related outcomes.
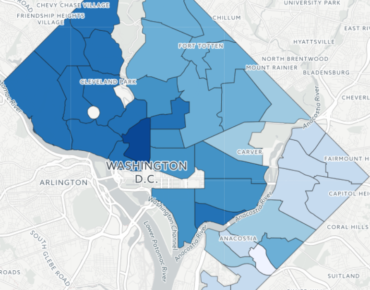
- Physical activity
- Poverty
- Commute times
Environmental barriers add a level of complexity to the lives of low-income residents pursuing a healthier lifestyle. As the Harvard T.H. Chan School of Public Health discusses, there are many ways that neighborhoods’ physical environments can affect residents’ health, with the presence of gyms being an obvious factor. In many cities, like D.C., these contributing factors are also tied to (and exacerbated by) longstanding racial disparities and segregation. For instance, one of the Chan School’s findings is that predominantly white and high-income neighborhoods tend to have more recreational facilities than lower-income or predominantly minority neighborhoods—a pattern that holds true in D.C., as the map shows.
Commercial gyms in D.C. are much more likely to be located in the central locations where many of D.C.’s residents and commuters work during the day, including Dupont and K Street, Downtown through Mt. Vernon, Southwest Waterfront, and around Union Station. There are no commercial gyms located east of the Anacostia River.
However, even if gym facilities were available in all neighborhoods, they might not be affordable to all residents. To address this, the D.C. Department of Parks and Recreation maintains Fitness Centers (shown on the map in purple) that offer various types of cardio and strength training equipment and are free for District residents.[1] These fitness centers are available in many neighborhoods across the city, although they often have relatively limited hours compared with commercial gyms—most are open from 10 a.m. to 8:30 p.m., and are closed on Sundays—and may not offer as many equipment options.
Time constraints due to long hours or long commutes can serve as an additional hurdle; in fact, research suggests that “time poverty may be more important than income poverty as a barrier to regular [exercise].” Commute times are included as a layer on the map in red, but data is not available for all neighborhoods. (For a more in-depth look at commute times and methods in the District, see my earlier article: Commute times for District residents are linked to income and method of transportation.)
Another aspect of residents’ physical environments—walkability—affects the rate of physical activity in adults. Walkability refers to many aspects of the built environment, including adequate sidewalks, crosswalks, and nearby leisure destinations. But public safety plays a role as well. Different studies have found that residents who identify their neighborhoods as dangerous are less likely to go outdoors and take part in physical activity, and are more likely to have a higher Body Mass Index (BMI).
About the data
Data for engagement in physical activity acquired from the 500 Cities Project’s Chronic Disease and Health Promotion Data & Indicators for 2014. The 500 Cities Project—Local Data for Better Health—is a collaboration among the Robert Wood Johnson Foundation, the CDC Foundation, and the Centers for Disease Control and Prevention (CDC), whose purpose is to provide high quality small area estimates for behavioral risk factors that influence health status, for health outcomes, and the use of clinical preventive services. You can explore more maps of health activities and outcomes in D.C. in this CDC Mapbook.
Information on poverty levels and commute times is from the U.S. Census Bureau’s American Community Survey (2015).
Data on number of gyms in D.C. acquired through Yelp (2017); a scraper accessed Yelp’s API to search for businesses that have key terms of “gym” or “fitness” on their page. Due to the nature of listings on Yelp, the number of gyms may not be exact depending on how up-to-date the data is; gyms that were determined to have closed (temporarily or permanently) are not included in the data.
The code for analysis and visuals used in this article are available on my GitHub.
