


Throughout the pandemic, many large cities, including the District of Columbia, have lost population due to out-migration. Researchers have found that (1) this exodus is pandemic-induced, and (2) many people are leaving behind large, high-cost cities in favor of less populated regions with a lower cost of living. Given this information, we compare the labor market’s recovery in large, high-cost metro areas to the recovery in lower-cost cities that continued to gain new residents throughout the pandemic. The comparison shows that lower-cost metro areas have emerged from the pandemic as more economically competitive than their high-cost peers, which may shift workforce dynamics to the D.C. region’s detriment.


This report is a publication of the D.C. Policy Center’s Alice M. Rivlin Initiative for Economic Policy & Competitiveness, which provides an in-depth and objective look at the factors that influence the District of Columbia’s attractiveness and competitive position in the region and the nation.
We wish to thank Fort Lincoln Realty Company, Inc., Quadrangle Development Corporation, The Ruben Companies, Tishman Speyer, and the Kimsey Foundation for their support of the Rivlin Initiative’s work.
Throughout the pandemic, many large cities, including the District of Columbia, have lost population due to increased out-migration.1 Researchers have found that this exodus is pandemic-induced: more than 12 percent of moves between April 2020 and December 2021 were influenced by COVID-19. Many people are leaving behind large, high-cost cities and metropolitan areas in favor of less-populated regions with a lower cost of living.2 In particular, high-income households are increasingly moving out of these large, high-cost places for lifestyle reasons rather than work-related reasons,3 implying that this shift is facilitated, in part, due to the rise of remote work.
Researcher Stephan Whitaker at the Federal Reserve Bank of Cleveland assessed whether lower-cost metro or rural areas can revitalize themselves by attracting remote workers from large, high-cost cities and metro areas. While it remains difficult to predict how many workers will permanently switch to telework, Whitaker found that if just five percent of remote workers leave large, high-cost metro areas, lower-cost, large metro areas (>2 million residents) could see a 2.5 percent increase in workers and mid-sized metro areas (500,000 – 2 million residents) could see a 2.8 percent increase in workers.4
As D.C. faces the new geography of work due to the rise of telework,5 other jurisdictions are becoming more competitive in attracting the District’s workers. This might boost the economy and labor market in smaller regions, but is it at the expense of D.C.’s economic competitiveness? In the analysis below, we compare the labor market recovery in large, high-cost metro areas to the recovery in the large, lower-cost cities that continued to see in-migration throughout the pandemic.


How we selected the cities included in this analysis
We identified the cities used in this analysis using Whitaker’s paper:
- Our group of ‘large, high-cost metro areas’ was taken directly from the paper, narrowed down to the 10 metro areas with the largest populations. Whitaker’s original list includes metro areas with populations greater than 2 million, and top-quartile median for-sale home list prices per square foot.
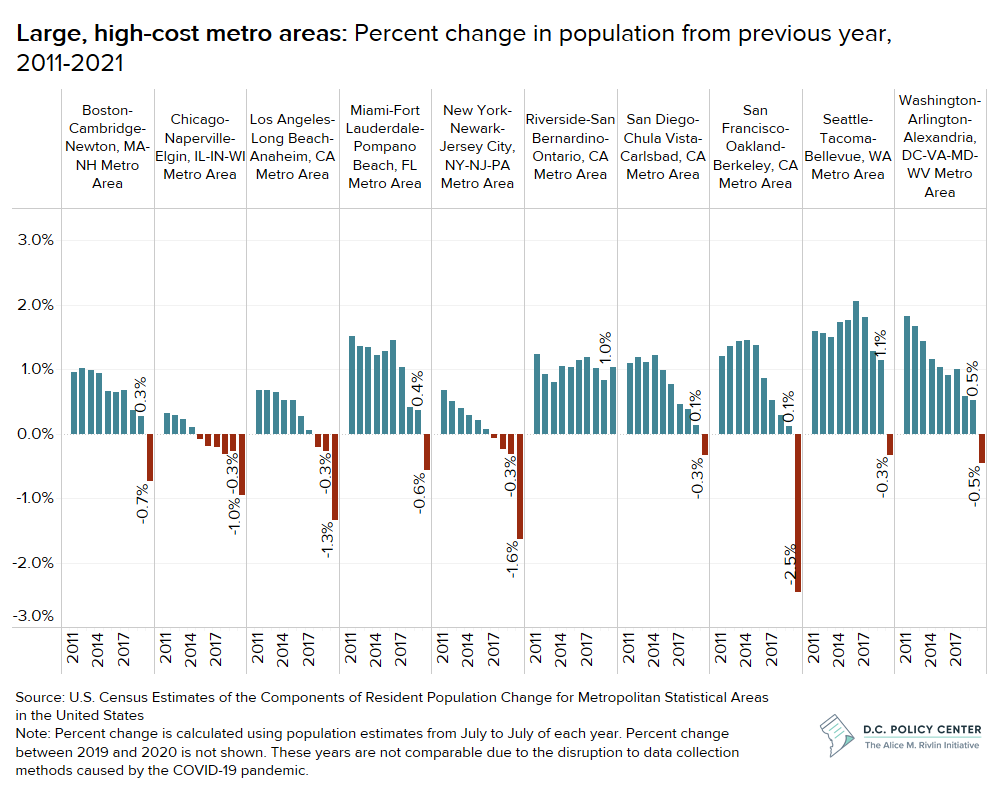
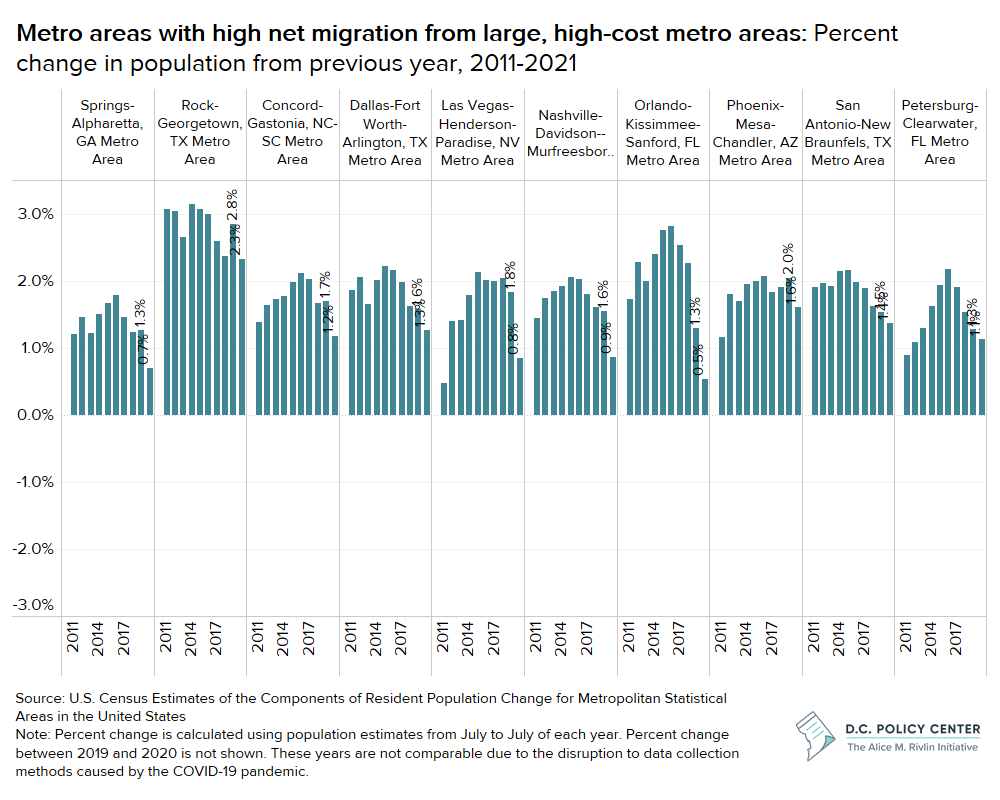
Population change data confirm that large, high-cost metro areas have lost residents to lower-cost metro areas during the pandemic.
U.S. Census estimates of population change show that large, high-cost metro areas have experienced a decline in population since the onset of the COVID-19 pandemic. For some metro areas, such as Chicago, Los Angeles, and New York, this population decline was a continuation of pre-pandemic population loss. Other metro areas, such as D.C., San Francisco, and San Diego, were already experiencing decelerating population growth, and the pandemic pushed them into a period of population loss.
Meanwhile, large but lower-cost metro areas (labeled in graphs as ‘metro areas with high net migration from large, high-cost metro areas’) experienced some decelerating population growth throughout the pandemic, but have yet to experience a population loss. This suggests that these areas were able to balance any out-migration with enough in-migration to achieve a net population gain.


Alongside population growth, total non-farm employment in lower-cost metro areas has been more resilient to the pandemic’s negative impacts.
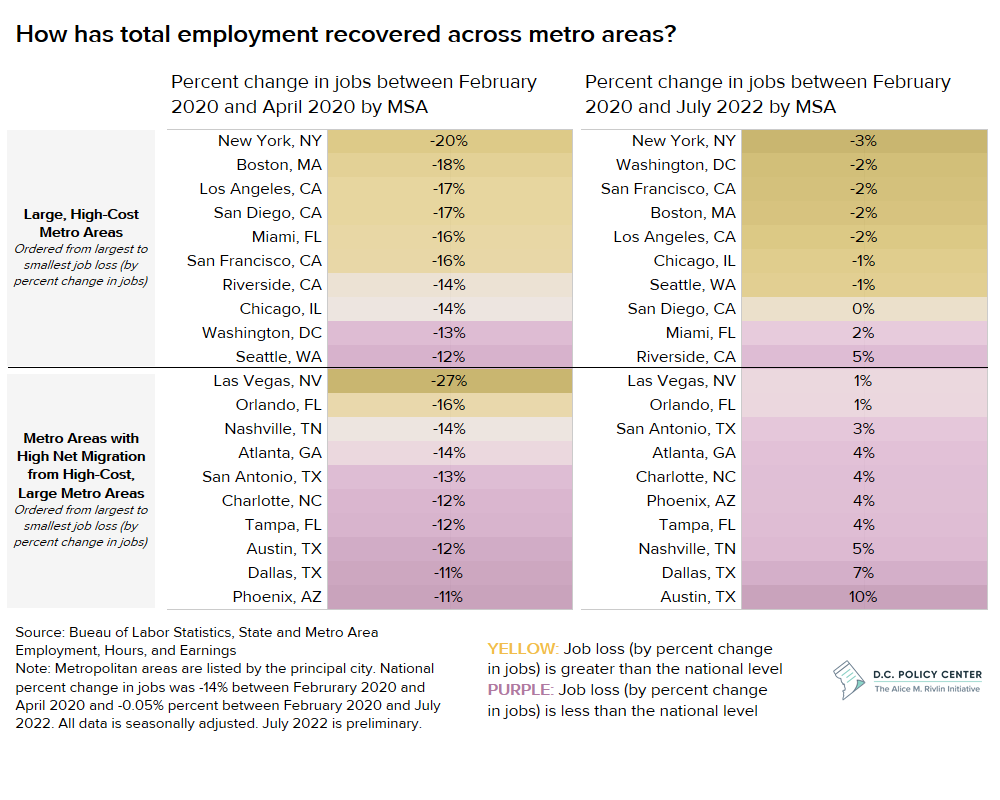
At the onset of the pandemic (between February 2020 and April 2020), non-farm employment declined across all metro areas.6 Metro areas that depend on in-person service jobs, such as Las Vegas, Orlando, and New York, experienced particularly high employment loss due to the pandemic.
Generally, large, high-cost metro areas seem to have lost a greater share of their jobs than their lower-cost peers. The D.C. metro area also had a relatively small percent change in jobs (a 13 percent decline compared to a 14 percent decline nationally) compared to other large, high-cost metro areas.7 This is likely due to the high concentration of remote eligible jobs, making it easier for many of the metro area’s workers to continue working through the economy’s shutdown. Additionally, the District is buffered from economic recessions due to the stability of jobs in the federal government.


Total non-farm employment
Total non-farm employment (or total jobs) measures employment in a region regardless of the residency of the worker. It typically excludes proprietors, private household employees, unpaid volunteers, farm employees, and the unincorporated self-employed. (Source: U.S. Bureau of Labor Statistics, Current Employment Statistics (State and Metro Area Employment, Hours, & Earnings))
Across large, high-cost metro areas, the greater initial job loss is paired with slower recovery of these jobs. As of July 2022, most of the large, high-cost metro areas, including the D.C. metro area, remain below pre-pandemic (February 2020) job levels. Meanwhile, the majority of metro areas that had high net migration from those high-cost, large metro areas now exceed pre-pandemic job levels by 4 percent or more.8 The relative resilience of smaller, lower-cost metro areas could be due to several reasons. First, the increase in population could have boosted the number of jobs, particularly if remote workers moved to these areas and permanently changed their addresses. It is also possible that differences in pandemic restrictions altered the job market: if public health restrictions were lifted sooner in some of the lower-cost metro areas or if the public became more willing to go out, services jobs could have had a jump start on recovery, compared to larger metro areas with more conservative restrictions.

Despite the relative resilience of lower-cost metro areas in the entire job market, recovery of the resident labor market is more difficult to interpret.
Resident unemployment remains higher than pre-pandemic levels in many metro areas, particularly in lower-cost metro areas. However, high unemployment levels may, in part, stem from the successful recovery of the labor force and increased population levels. Additions to the population can increase unemployment if those new residents are in search of work.


Resident labor market
The resident labor market is measured by several indicators: employment, unemployment, and labor force. Employment data include the number of residents who live in the region are employed, regardless of the location of their employment. Unemployment data include the number of residents who live in the region, are not employed, and are looking for work. Labor force is the sum of resident employment and unemployment. (Source: U.S. Bureau of Labor Statistics, Local Area Unemployment Statistics.)
In fact, with the exception of the Las Vegas metro area, which has many tourism and service-industry jobs, all lower-cost metro areas listed have resident employment and labor force levels that now exceed pre-pandemic levels. In contrast, many of the large, high-cost metro areas continue to lag behind pre-pandemic resident employment and labor force levels (D.C. metro area remains 4 percent behind pre-pandemic levels on both metrics).9
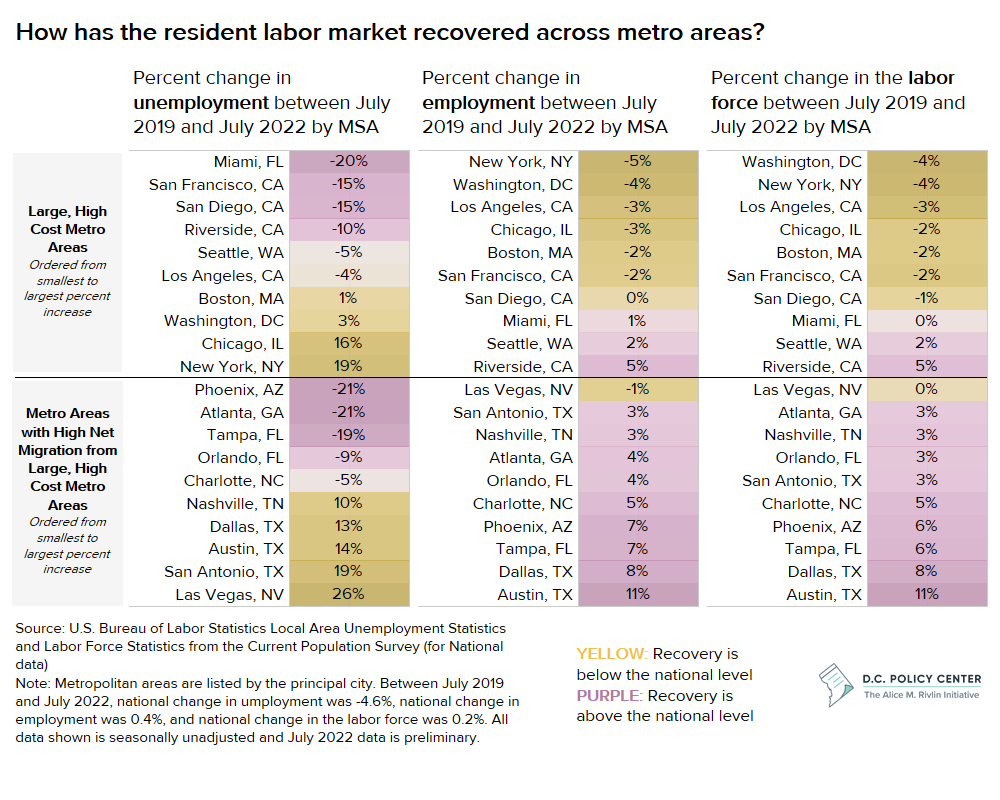

The declining resident labor force is particularly concerning for large, high-cost metro areas, such as D.C., because it implies (1) an out-migration of workers and/or (2) a lack of workers who are able to return to work.
Early on in the pandemic, many workers in D.C. left the labor force due to personal reasons, such as child care costs, child care access, or health concerns.10 In recent months, the labor force in D.C. has begun to show positive signs for recovery.11 However, the continued lag behind pre-pandemic levels compared to lower-cost metro areas suggests that it might be more costly to return to work in the D.C. metro area and other large, high-cost metro areas. It may also simply reflect workers leaving the area entirely, even if those workers keep their D.C. metro area-based jobs.
The prevalence of remote work makes certain labor market measures more difficult to interpret. It is possible, for example, that a D.C. remote worker who lives in the metropolitan Washington region can move to a smaller metro area, but keep their job in D.C. This would reduce the regional labor force (which measures residents available for work regardless of where they work), but not impact the regional workforce (which includes resident and non-resident employment). The risk is if these remote workers eventually leave the District’s job market, workforce dynamics may permanently shift to the region’s detriment.
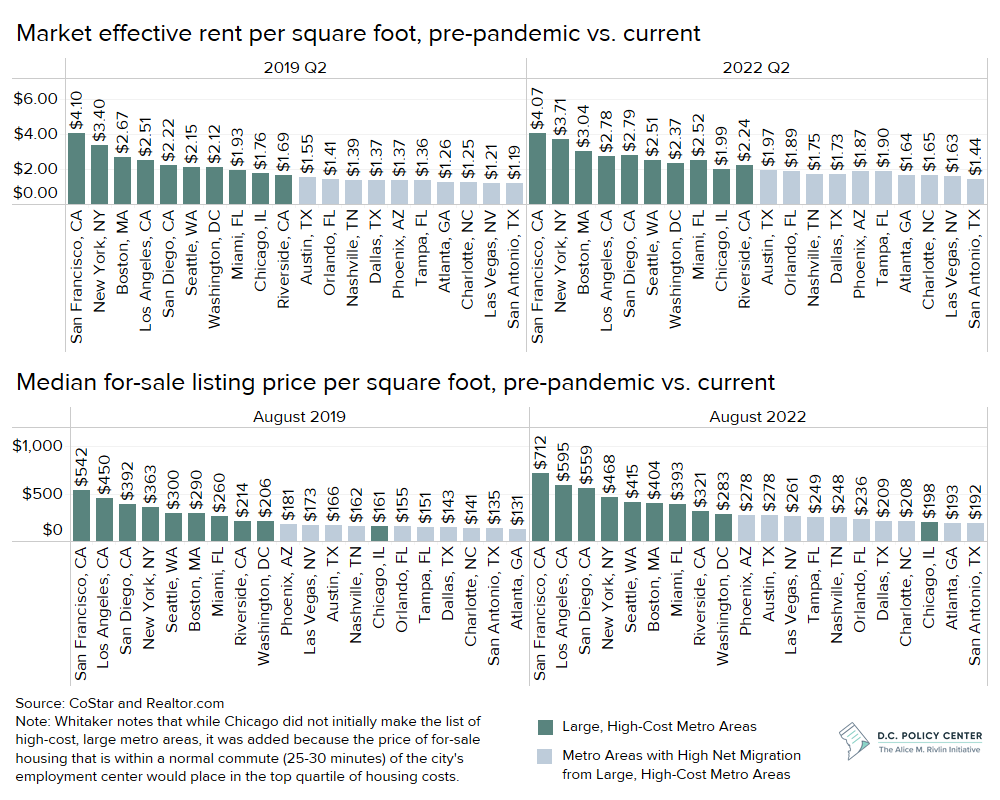
The increase in jobs and residents has increased the cost of living in lower-cost metro areas. Nonetheless, large, high-cost metro areas remain more expensive overall.
The increased demand in lower-cost metro areas is putting upward pressure on housing costs. While nearly all metro areas have seen a rise in housing prices compared to pre-pandemic, this increase is particularly steep in the lower-cost metro areas (or, the areas receiving more net migration from the high-cost, large metro areas).
In the lower-cost, high-demand metro areas, rent increased by an average of 29 percent (among the metro areas included in the analysis) while rent in large, high-cost metro areas increased by an average of 14.6 percent.12 Similarly, for-sale listing prices increased by an average of 52.5 percent in lower-cost, high-demand areas, while listing prices increased by an average of 37.3 percent in large, high-cost metro areas.13
This implies that lower-cost metro areas are attracting more high-income workers who can buy or rent more expensive homes. Past research suggests that in D.C., this is the case: 61 percent of net tax filers who moved out of the city between 2019 and 2020 had incomes greater than $100,000.14


Despite the steep increases in rent in lower-cost metro areas, the large, high-cost metro areas remain more expensive. If lower cost of living is a strong contributing factor to in-migration, this suggests that high-income households may continue to move out of high-cost metro areas.

What do these observations mean for D.C. and other large, high-cost metro areas?
As remote work continues to remain popular among office workers and worker preferences shift, D.C. not only has to compete with its neighbors in the immediate region, but also large and small cities throughout the country for attracting talent. While this has always been the case, as telework gives many workers additional flexibility in choosing where they live relative to where they work, it is easier for local talent to live elsewhere while still remaining in the local workforce.
Can this be a sustainable equilibrium? Will these workers, when they eventually change jobs, stay in the regional workforce, or will they be more inclined to take jobs somewhere else, perhaps closer to the new place where they have chosen to live? This is an important question that has strong bearings on the future growth of the District and the surrounding region. And it highlights the importance of efforts and policies that would allow the District to retain residents and workers in industries that have traditionally been the city’s strengths.
Editor’s note: On November 1, 2022, we adjusted the headline of this publication to”What do migration and labor force trends tell us about D.C. and other large, high-cost metro areas?” from a previous headline that implied the data this article discusses should be used to speculate about future conditions.


In future work, the Rivlin Initiative will look at regional workforce dynamics to better understand how employment opportunities and relative industrial and occupational strengths contribute to interjurisdictional competitiveness trends. This will include a deeper dive into what industries and occupations have emerged as strengths in recent years, what factors are contributing to the current spatial distribution of the region’s workforce, and what these trends mean for the future of the District of Columbia. This will allow the city to plan for the future, particularly as the city’s industry strengths and weaknesses may have shifted during the pandemic.
Endnotes
- Kathpalia, Sunaina Bakshi (2021). “Births and international in-migration maintain the District’s population 15-year population growth.” D.C. Policy Center, Washington, D.C.
- Haslag, Peter H. and Weagley, Daniel (2022). “From L.A. to Boise: How Migration Has Changed During the COVID-19 Pandemic.” Available at SSRN: https://ssrn.com/abstract=3808326 or http://dx.doi.org/10.2139/ssrn.3808326
- Haslag, Peter H. and Weagley, Daniel (2022). “From L.A. to Boise: How Migration Has Changed During the COVID-19 Pandemic.” Available at SSRN: https://ssrn.com/abstract=3808326 or http://dx.doi.org/10.2139/ssrn.3808326
- Whitaker, Stephen (2021). “Migrants from High-Cost, Large Metro Areas during the COVID-19 Pandemic, Their Destinations, and How Many Could Follow.” Federal Reserve Bank of Cleveland.
- McConnell, Bailey and Sayin, Yesim (2022). “Remote work and the future of D.C. (Part 2): What does remote work mean for the District of Columbia’s tax base?” D.C. Policy Center, Washington, D.C.
- Job loss is measured by percent change in jobs in order to compare the scale of loss across all metro areas.
- U.S. Bureau of Labor Statistics, Current Employment Statistics (State and Metro Area Employment, Hours, & Earnings)
- U.S. Bureau of Labor Statistics, Current Employment Statistics (State and Metro Area Employment, Hours, & Earnings)
- U.S. Bureau of Labor Statistics, Local Area Unemployment Statistics
- Hornstein, Andreas and Kudlyak, Marianna (2022). “The Pandemic’s Impact on Unemployment and Labor Force Participation Trends.” Federal Reserve Bank of Richmond.
- McConnell, Bailey (2022). “Charts of the week: Back to work(ing).” D.C. Policy Center, Washington, D.C.
- CoStar
- Realtor.com
- McConnell, Bailey and Sayin, Yesim (2022). “Puzzle of the week: Why are D.C.’s withholding taxes growing, if residents and tax filers are leaving?” D.C. Policy Center, Washington, D.C.
