The D.C. Policy Center’s recent report, Transition to College or Career for the District’s High School Students, examined what we do and don’t know about outcomes for D.C.’s high schoolers. Fifty-six percent of D.C.’s high school graduates continue to postsecondary within six months of completing high school, but we don’t know much about where they attend postsecondary, which degree they complete, what they study, or other outcomes.
This analysis looks at national Integrated Postsecondary Education Data System (IPEDS) data to get a sense of characteristics of postsecondary institutions where D.C.’s former students enroll – especially what types of institutions they choose and outcomes for all students who attend these institutions.
In the fall of 2018, there were 2,728 first-time degree or certificate-seeking undergraduate students who graduated from high school in the past 12 months[1] and had lived in D.C. when they were first admitted, attending a total of 495 colleges and universities. These students include some private high school graduates from D.C., as an estimated 17 percent of high school students living in D.C. attend private school.[2] Nonetheless, this cohort in IPEDS is the best source currently available to give a sense of where public high school students from D.C. attend postsecondary, as public high school students comprise the majority of this group.
By location, almost half (43 percent) of these first-time students stay close to home, attending college in D.C. or its neighboring states of Maryland and Virginia. D.C. attracts the highest percentage of first-time students compared to other states, at 20 percent, with the University of the District of Columbia and Trinity Washington University enrolling the most students (304 and 97, respectively). Outside of D.C., Delaware State University and Montgomery College are the most popular institutions, enrolling 67 and 61 students, respectively.
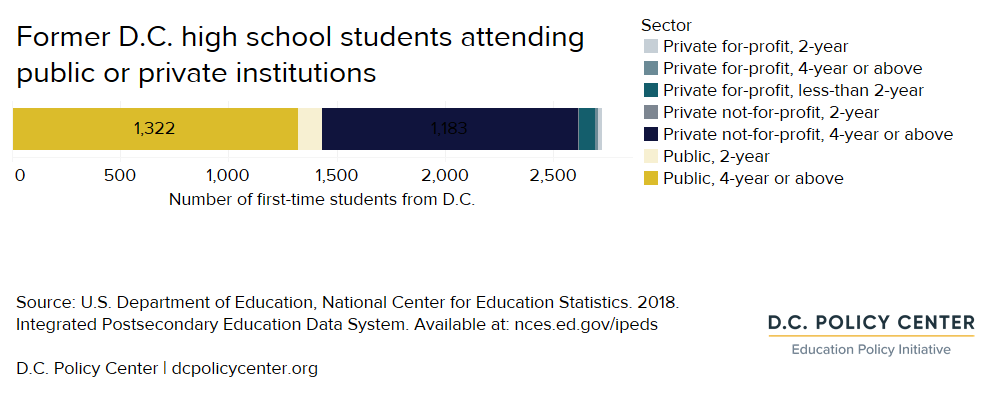
About half (52 percent) of D.C.’s former high school students enrolled at public institutions. The remaining 48 percent attend private institutions – only four percent of all students attend a for-profit institution. Students from D.C. attending public institutions are eligible to receive $10,000 toward tuition through the DC Tuition Assistance Grant (DCTAG) if their household income is under a certain threshold.[3] There is also a lower level of DCTAG funding, at $2,500, for private colleges in the Washington, D.C. metropolitan area. This funding could incentivize attendance at public institutions and private institutions close to home.

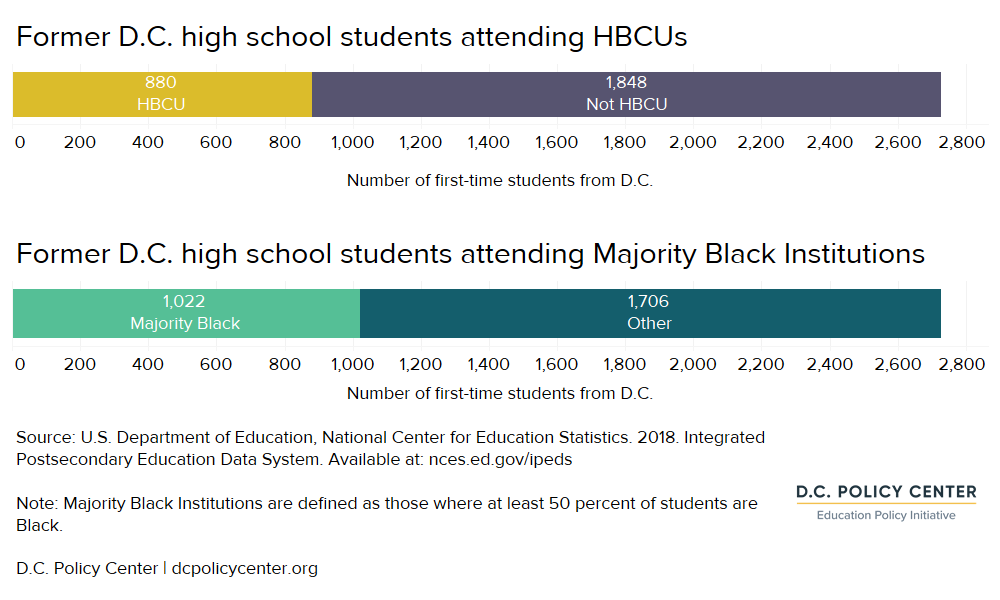
In the 2017-18 school year, Black students comprised 73 percent of D.C.’s four-year high school graduates of traditional public and public charter schools.[4] Out of all students enrolling in postsecondary for the first time from D.C., 37 percent attended a postsecondary institution where at least half of the undergraduate students are Black. In a different category, 32 percent attend an HBCU, almost all of which also have a majority of Black students. The most popular HBCUs aside from the University of the District of Columbia (304 students from D.C.) are Delaware State University (67 students from D.C.) and Norfolk State University (51 students from D.C.). Students who attend HBCUs are also eligible for $2,500 in DCTAG funding.

An estimated 36 percent of former D.C. high school students who enroll in postsecondary complete it within six years of enrolling.[5] However, average graduation rates are higher across the 495 institutions attended by former D.C. high school students.[6] The average graduation rate within three years for two-year schools, and six years for four-year schools, was 60 percent for all students receiving Pell grants[7]. It was 69 percent for all students who did not receive Pell grants.[8] This suggests that D.C. students compete postsecondary at lower rates than their peers at these institutions.
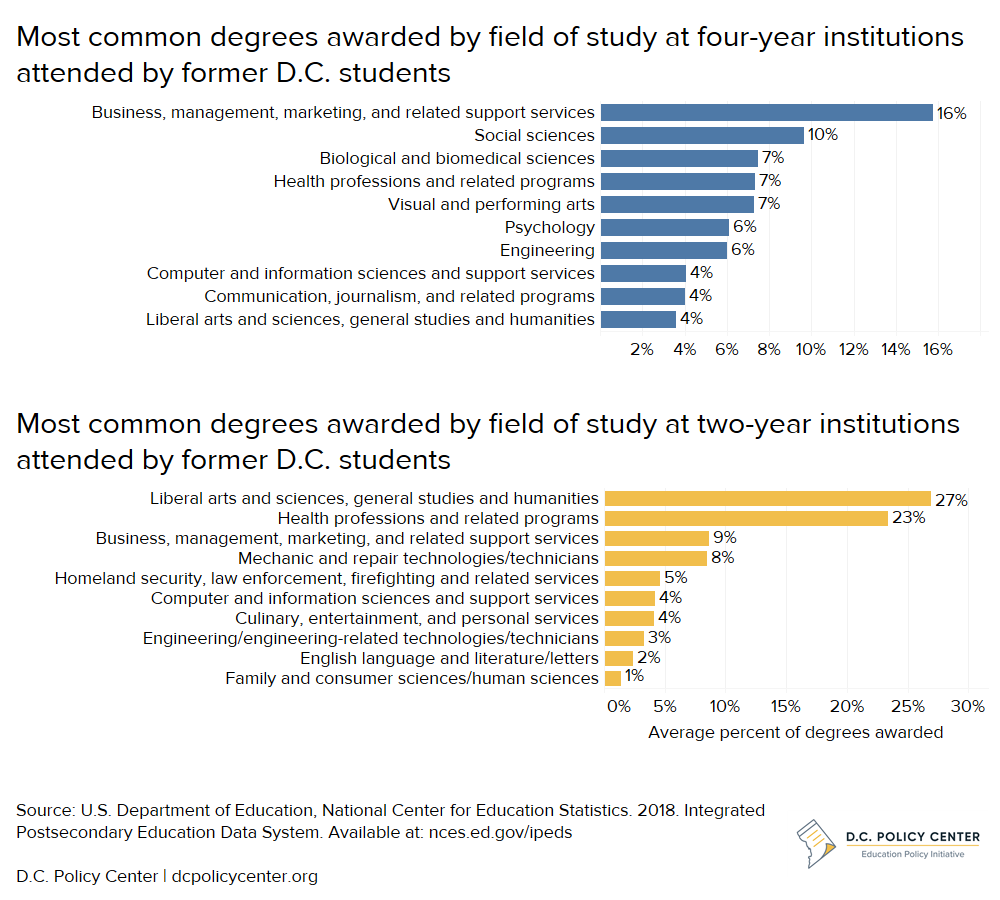
Data aren’t available on the subjects that D.C.’s high school graduates study. However, a look at the most popular majors at the 495 institutions attended by these students shows that the majority of students at four- and two-year institutions complete one of these majors in the chart below.[9] We don’t know whether D.C.’s former high school students pursue these majors in these proportions, but some of these popular majors, like Business, Management, and Marketing, are well-aligned with available jobs in D.C. that require a postsecondary degree.

Some data are available on the degree of social mobility at these institutions from the Opportunity Insights project. At the institutions attended by former D.C. students, 11 percent of students were from households in the lowest 20 percent of income and 4 percent of students were from households in the top 1 percent of income. The median parental income at these institutions was around $93,000. These institutions have an average mobility rate of 2.4 percent, which is the percent of students coming from the bottom 20 percent of income distribution who made it to the top 20 percent of income distribution by their early thirties. This is better than the national average social mobility of the 2,203 colleges at 1.7%.[10]
This analysis looks at where students from D.C. attend postsecondary in an effort to estimate postsecondary outcomes. It is a small step toward an effort to follow DCPS and public charter school high schoolers as they become young adults, including their degree of success in postsecondary and the workforce.
Chelsea Coffin is the Director of the Education Policy Initiative at the D.C. Policy Center.
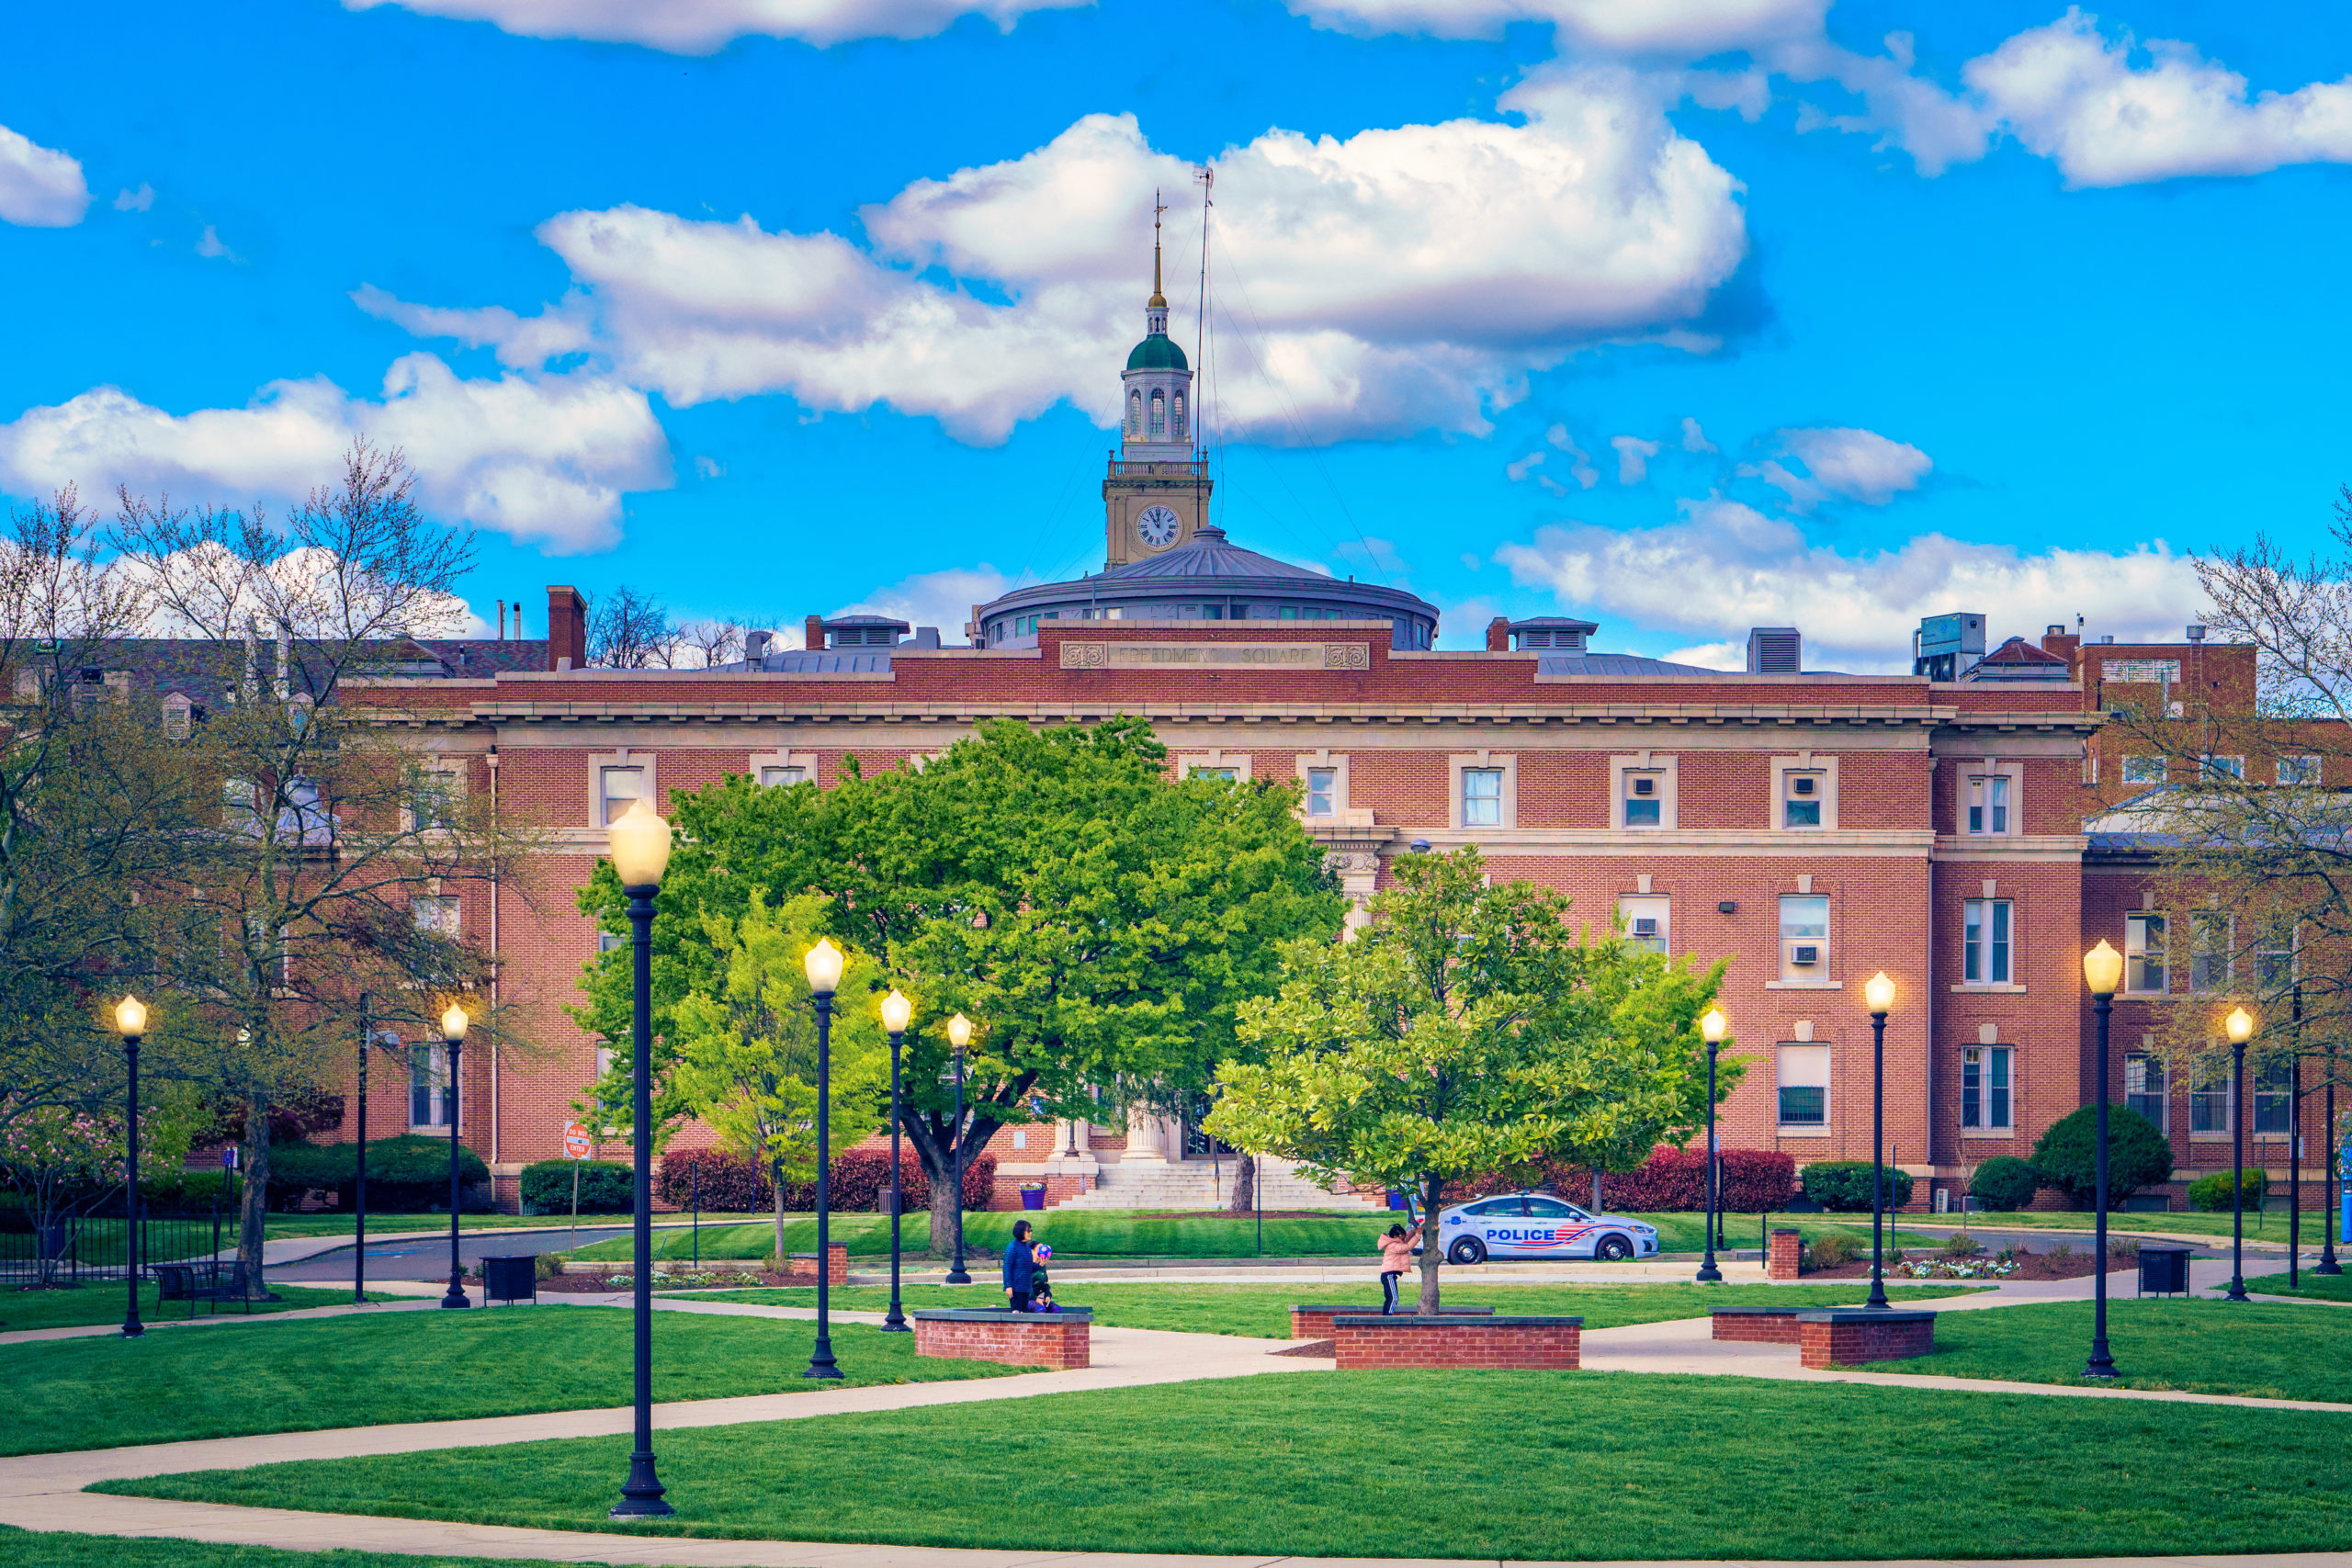
Feature photo of Howard University from Ted Eytan (Source)
Notes
[1] These figures miss those who enroll later or transfer.
[2] U.S. Census Bureau. American Community Survey 5-Year Estimates, 2014-2018. Available at: https://data.census.gov/cedsci/
[3] The household income maximum to receive DCTAG funding is currently a little higher than $500,000.
[4] Office of the State Superintendent of Education. 2018. DC 2018 four-year Adjusted Cohort Graduation Rates, by student group. Available at: https://osse.dc.gov/publication/2017-18-adjusted-cohort-graduation-rate
[5] Office of the State Superintendent for Education (OSSE). OCA District Performance Plan FY2018. Available at: https://oca.dc.gov/sites/default/files/dc/sites/oca/publication/attachments/OSSE18.pdf
[6] This is calculated as a simple average without weights
[7] Pell students have a high degree of unmet financial need.
[8] U.S. Department of Education, National Center for Education Statistics. 2018. Integrated Postsecondary Education Data System. Available at: nces.ed.gov/ipeds
[9] U.S. Department of Education, National Center for Education Statistics. 2018. Integrated Postsecondary Education Data System. Available at: nces.ed.gov/ipeds
[10] Opportunity Insights. 2020. Preferred Estimates of Access and Mobility Rates by College. Available at: https://opportunityinsights.org/wp-content/uploads/2018/03/Codebook-MRC-Table-1.pdf
