
This report examines housing affordability for essential workers—those who provide critical services for the city and its residents—in the District of Columbia. It is the latest publication in a series of papers focused on workforce housing in the District of Columbia. The main takeaways include:
- The District of Columbia has about 85,112 households headed by essential workers across 30 occupations vital to the city’s functioning.
- Many of the essential workers who work in D.C. live outside the District. In 2022, only 36 percent of the District’s essential workers resided in D.C., compared to 66 percent of the overall workforce who do not work remotely.
- More essential workers living in the city would benefit the workers, employers, and the District.
- Essential workers who rent are more likely to live in D.C. (55 percent) compared to essential workers who are homeowners (28 percent).
- Rent is expensive in D.C., with high burdens on essential workers across all wards and household sizes. Most single essential workers are priced out and essential worker households need dual incomes to afford a one-bedroom apartment in most wards.
- For policymakers, the challenge is to retain essential workers living in the city and to attract those from the suburbs. There are 36,646 renter households headed by essential workers who can be encouraged to move to or stay in D.C.
- Two-thirds of renter households headed by essential workers earn at or below 80 percent of the Area Median Income (AMI) and are eligible for subsidies, but there is insufficient subsidized housing to meet the need. Essential worker households eligible for subsidies make up only a fifth of all eligible renter households.
- The District needs housing policies that increase supply at all price points, types, and across all wards. This requires rethinking zoning laws, permitting processes, and affordability approaches.
- Employers can benefit from more essential workers living in the city. Increasing employer engagement in housing can be an important way to create affordability and support essential workers living closer to their workplaces.
Other reports in this series
- Early Childhood Educators in D.C. and Housing: Part I, Where do early childhood educators work?
- Early Childhood Educators in D.C. and Housing: Part II, Where do early childhood educators live?
Introduction
Essential workers in the District of Columbia provide critical services for the city’s functionality and residents’ well-being. They include medical professionals, teachers, early childhood educators, first responders, and workers in the hospitality sector. Despite their importance, many of these jobs pay relatively low wages, making it difficult for essential workers to afford housing in D.C. As a result, many of D.C.’s essential workers live outside the District. For example, in 2023, 41 percent of the District’s early childhood educators lived outside of the city,1 along with 77 percent of hotel workers, 66 percent of healthcare support workers, 30 percent of kindergarten teachers, and 64 percent of police officers.2
While it is expected that some workers would live outside D.C. due to the city’s relatively small size and proximity to Virginia and Maryland suburbs, the “residency disparity” between essential workers and the general workforce is significant. In 2022, an estimated 66 percent of the District’s workforce who did not work from home lived in the city.3 However, only 36 percent of essential workers, and 39 percent of households headed by a D.C. essential worker lived in the city.4
This trend partly reflects preferences for larger or more affordable housing options available in the suburbs, particularly for homeownership. Approximately 60 percent of essential workers who work in D.C. are homeowners, but less than a quarter of them are D.C. residents. Homeownership, whether in D.C. or elsewhere in the region, is more common among essential workers with higher incomes such as registered nurses, firefighters, and police officers. In contrast, nearly half of essential workers who are renters live in D.C. (55 percent) and they are more likely to be lower-wage workers such as food service workers, hotel workers, and childcare workers.
Essential workers and households headed by an essential worker who work in D.C., 2022

Housing affordability is a critical issue for D.C.’s essential workers, many of whom are priced out of the city. This leads to challenges with employee retention, job satisfaction, and filling critical positions. To increase essential worker residency in D.C., we need housing policies that increase the supply of housing across all wards and housing types. Since many essential workers are renters, the key is to increase affordable rental housing options near their workplaces. Employers are a group that can be motivated to support housing solutions for essential workers.
Who are the essential workers in the District of Columbia?
According to Bureau of Labor Statistics data, in 2023, the District’s workforce included an estimated 104,710 essential workers in occupations vital to the city’s proper functioning (see appendix for full list of occupations classified as “essential” for the purposes of this study). The median annual salary for these workers varied between $35,960 (dishwashers) and $133,280 (nurse practitioners).5
In 2022, there were an estimated 85,112 households in the Washington metropolitan headed by an essential worker who worked in the District.6 Among these, 39 percent lived in the District. The average household income for households headed by an essential worker was approximately $105,000.7 Workers who live in D.C. had an average household income of $107,000 compared $101,000 for those who live in Maryland, and $109,000 for those who live in Virginia.8
A typical household with an essential worker as the head of household had three people living together, and this did not change by location. Renter households headed by an essential worker tended to be larger in MD (4 persons) and smaller in VA (2 persons).9
Why it matters that essential workers live close to where they work
Living close to work provides various economic, environmental, social, and personal benefits for workers, employers, and the entire city.
Benefits for the workers
Shorter commute times are associated with overall well-being and life-satisfaction. Active commuting (such as biking or walking) can mitigate some negative impacts of commuting, but this benefit diminishes with longer commute times and distances.10
Shorter commutes contribute to better work-life balance. Long commutes are linked to stress,11 depression,12 higher anxiety levels,13 and lower job satisfaction,14 which can affect job performance and increase quit rates. Moreover, stress and fatigue from lengthy commutes can reduce the time and energy workers have for their families,15 personal pursuits, and overall wellbeing.16
Shorter commutes impose lower costs. Expenses for fuel, public transportation fares, or vehicle maintenance can significantly reduce an individual’s disposable income. The opportunity cost of commuting is time and resources that could be spent on more rewarding endeavors such as other income-generating activities or leisure.
Short commutes can also offer wage benefits that help both the workers and the city. Cities like the District of Columbia offer much higher wages across all occupations partly because of the concentration of higher productivity workers. This wage premium usually holds true for essential workers too, who oftentimes work alongside higher paid colleagues. For example, in 2023, dental assistants in D.C. earned a 7 percent premium over dental assistants across the entire Washington metropolitan area.17 This premium was 6.5 percent for nursing assistants and 6 percent for preschool teachers. When workers, especially less credentialed ones are priced out of employment centers, they miss out on better paying job opportunities.18
Benefits for the employers
Shorter commutes are associated with lower employee turnover. For example, a longitudinal study on personnel data from 2008-09 to 2019-20 found that, in a given year, teachers and principals with commutes over 45 minutes to work were 10 percentage points more likely to leave their jobs compared to those with shorter commutes.19 Less turnover means lower training and hiring expenses. Turnover costs an average of one-fifth of an employee’s yearly salary due to hiring, training, and lost productivity.20
Shorter commutes can also result in higher productivity. Long commutes correlate with higher absenteeism,21 affecting profit margins as businesses incur extra costs due to absenteeism.22
Benefits for the city
Cities with shorter commutes have higher growth potential. Research shows a positive correlation between job proximity and better hiring rates, lower job turnover, a more stable workforce, and faster economic development, which in turn, increases revenue capacity.23
Job proximity also benefits the environment. Shorter commutes can reduce greenhouse gas emissions, alleviate traffic congestion in urban areas, lower fuel consumption, and decrease air pollution.
Improved job access for low-income and non-white populations can improve social equity, reduce economic segregation and decrease dependence on social safety networks. Long commutes particularly impact these groups, potentially worsening employment disparities24 and could lead to prolonged periods of joblessness or hinder wealth building. For employers, this means unfilled job listings and unmet business demand. In cities, prolonged joblessness leads to poverty, weakened social networks, increased reliance on social welfare systems, and higher crime rates.25 Labor shortages reduce economic efficiency, productivity, and tax revenues.26
A D.C. Policy Center survey of businesses found that 62 percent consider “proximity to workforce” important for location decisions.27 Increasing the proportion of workers living in D.C. and near employment centers can improve job retention, enhance business climate, increase the District’s competitiveness in the region, and elevate quality of life for District residents. When essential workers are priced out of D.C., the city faces lower economic growth28 and higher levels of income and racial segregation.29 This underscores the importance of targeted housing interventions, particularly in the rental market, to attract and retain essential workers.
How well does the District’s rental housing market serve essential workers?
The District has an estimated 340,534 housing units, of which 201,820 units are rentals.30 Specifically, there are 146,972 rental apartment units spread across 3,146 buildings. These units are roughly evenly distributed throughout the District’s eight wards, with the highest concentration (about 20 percent) in Ward 6.
The population boom from 2000 to 2020 spurred multifamily construction, including construction of apartment buildings that has continued into the present.31 Between 2019 and 2024, the District added 22,322 net new rental apartment units—an 18 percent growth. However, these units are concentrated in newer neighborhoods like Navy Yard, Southwest Waterfront, NoMa, and Union Market.32
Finding #1: Rents vary greatly across the District
Due to the distribution of new housing and significant differences in the quality of housing stock and neighborhood amenities, rents vary greatly across the city. Using data from CoStar, we estimated the average rents for one-bedroom, two-bedroom, and three-bedroom apartments throughout the District. The maps below show average rents by unit size and ward. Across all apartment types, Wards 2 and 3 are the most expensive, while Wards 7 and 8 are the least expensive, with rents typically 60 percent or less than those in Wards 2 and 3.
Finding #2: Rental housing is expensive for many households in D.C.
Of the approximately 327,000 households in the District of Columbia, 187,998 are renters. These households rent several types of housing, including market-rate and subsidized rental apartments, units in condominium buildings, flats, converted units, and single-family homes. Data from the American Community Survey (ACS) reveal that among all renter households, gross rent is 38 percent of annual income. Approximately 32 percent of all renter households spend more than 30 percent of their income on rent, and one in ten renter households spend more than half of their annual income on rent.
Rent burden is an important concern for the city. Rent-burdened households face risks to their financial well-being and socioeconomic standing, such as difficulty saving and investing money or securing necessities like groceries or utilities. These households are more vulnerable to the effects of unexpected events such as medical emergencies, vehicle repairs, or income loss. Prolonged financial distress can negatively impact familial ties, childhood development, marriage, emotional health, and physical health.33
This report examined households with one to four members (suitable for studio, one-bedroom, two-bedroom, and three-bedroom units, respectively) that report renting in the District. Using the commonly accepted criterion that housing costs should not exceed 30 percent of household income, we estimated the annual household income necessary to avoid rent burdens. We then analyzed the share of households of different sizes to determine which would be priced out of rental housing in each ward.
The data show that for studio apartments, over 50 percent of single-person households cannot afford rental units in Wards 1, 2, 3, and 6. Even in the relatively lower-rent Wards 7 and 8, 41 percent and 48 percent of households are priced out, respectively. One-bedroom apartments are relatively more affordable for two-person households across all wards. However, rents for larger apartments with two or three bedrooms are increasingly exclusionary. For example, 65 percent of three-person households and 85 percent of four-person households are priced out of Ward 2.
Share of renter households priced out of rental apartments, by ward

Finding #3: An even larger share of essential workers are priced out of the District’s rental market.
Replicating the same analysis for D.C.’s essential workers reveals that even fewer of these workers can afford renting in the District of Columbia. Housing affordability is influenced by factors such as household size and the number of working adults. According to estimates from ACS, about half of D.C.’s essential workers are married (47 percent). Additionally, 23 percent have children or other family members but no spouse, 13 percent live in non-family households, and 17 percent live alone.
Examining the affordability of rental apartments by size and ward shows that essential workers who live alone are most often priced out of the District. In other words, multiple incomes are necessary for essential worker households to afford average rental prices in the District, even for one-bedroom apartments. While multiple incomes make one- and two-bedroom apartments affordable, half of all essential workers are priced out of three-bedroom apartments in all wards except Wards 7 and 8.
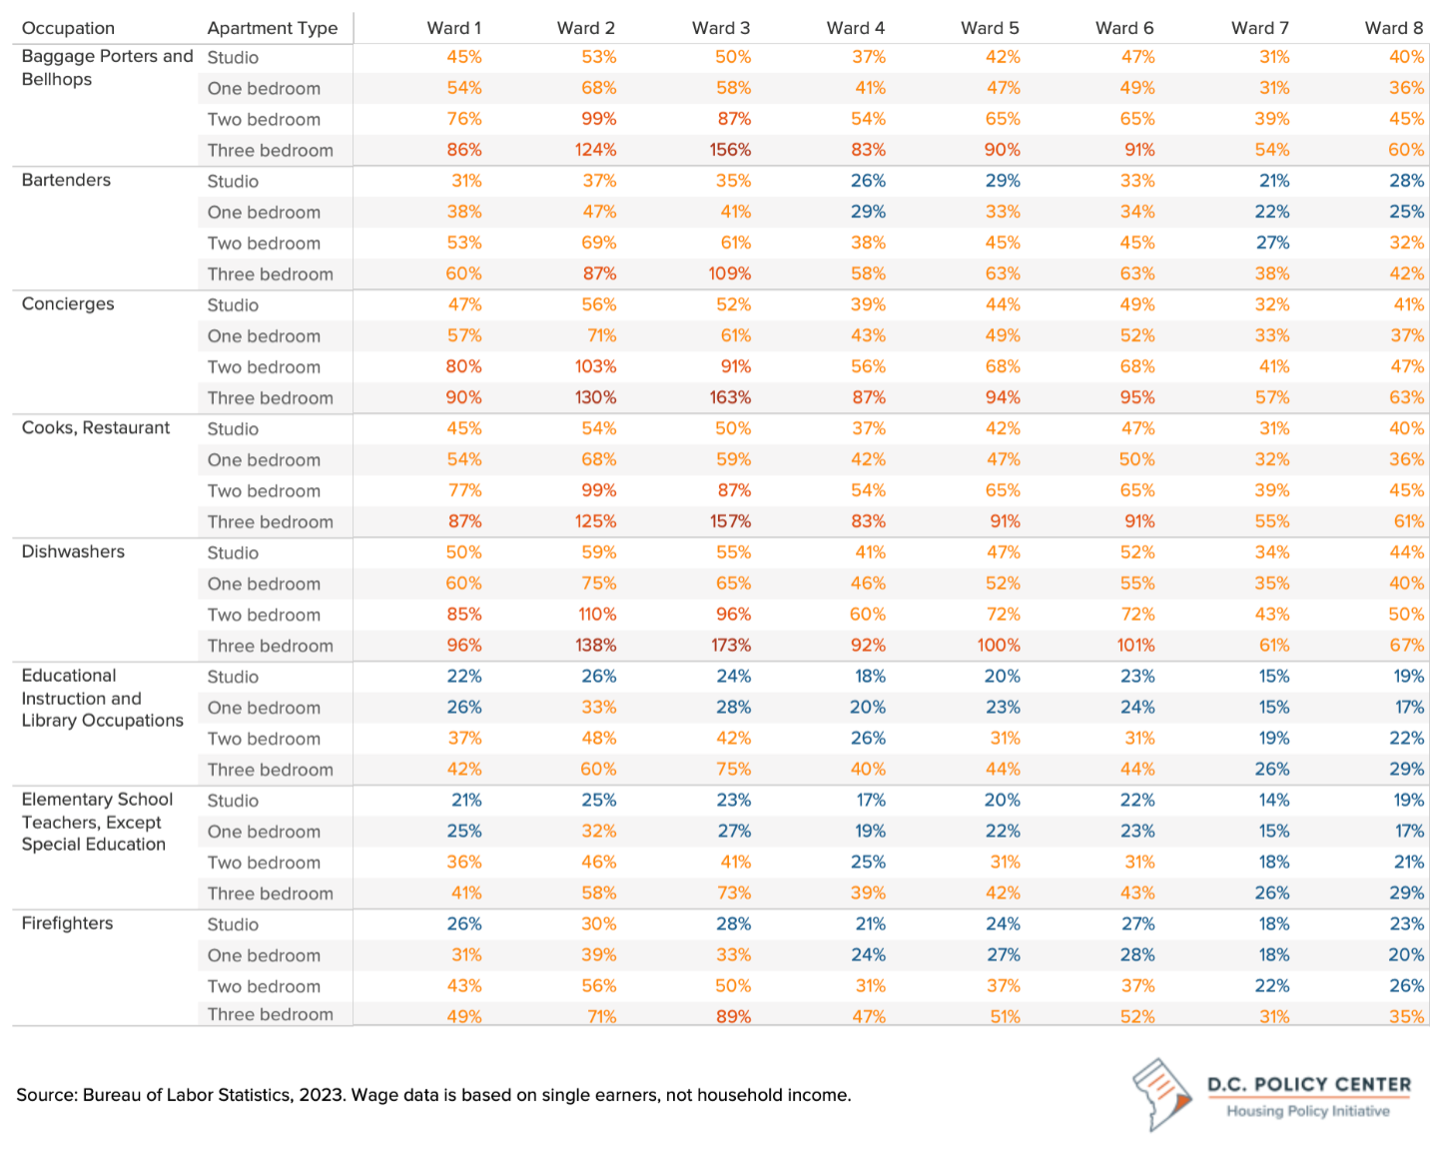
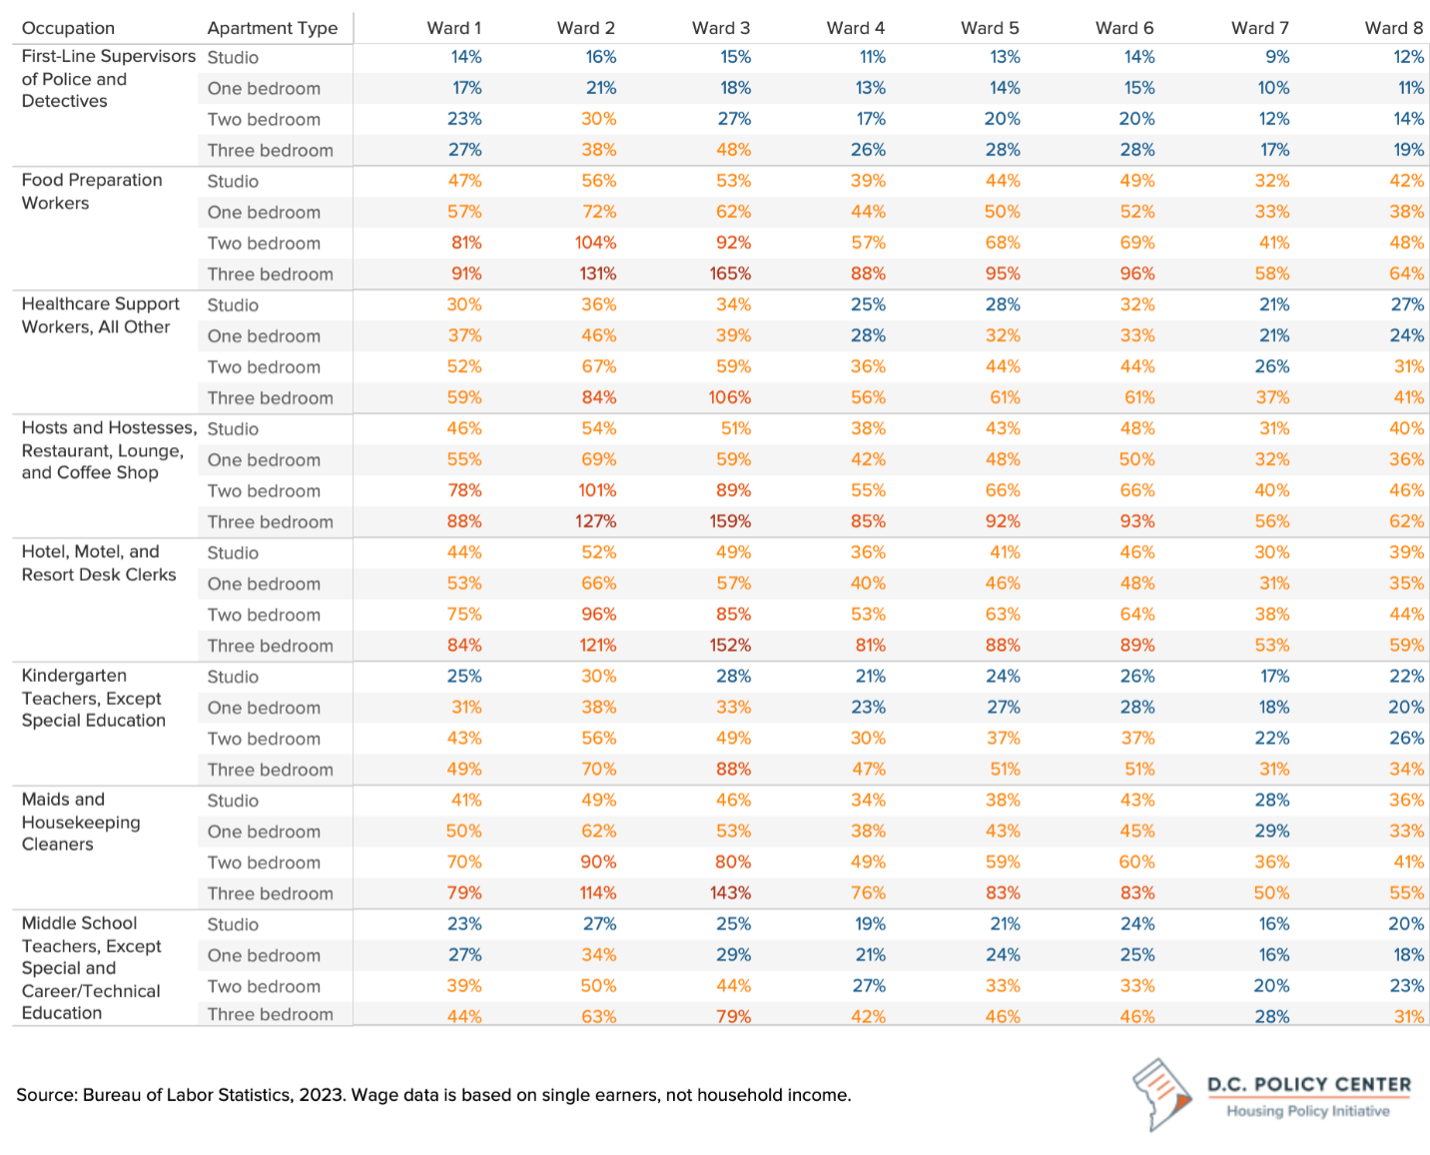
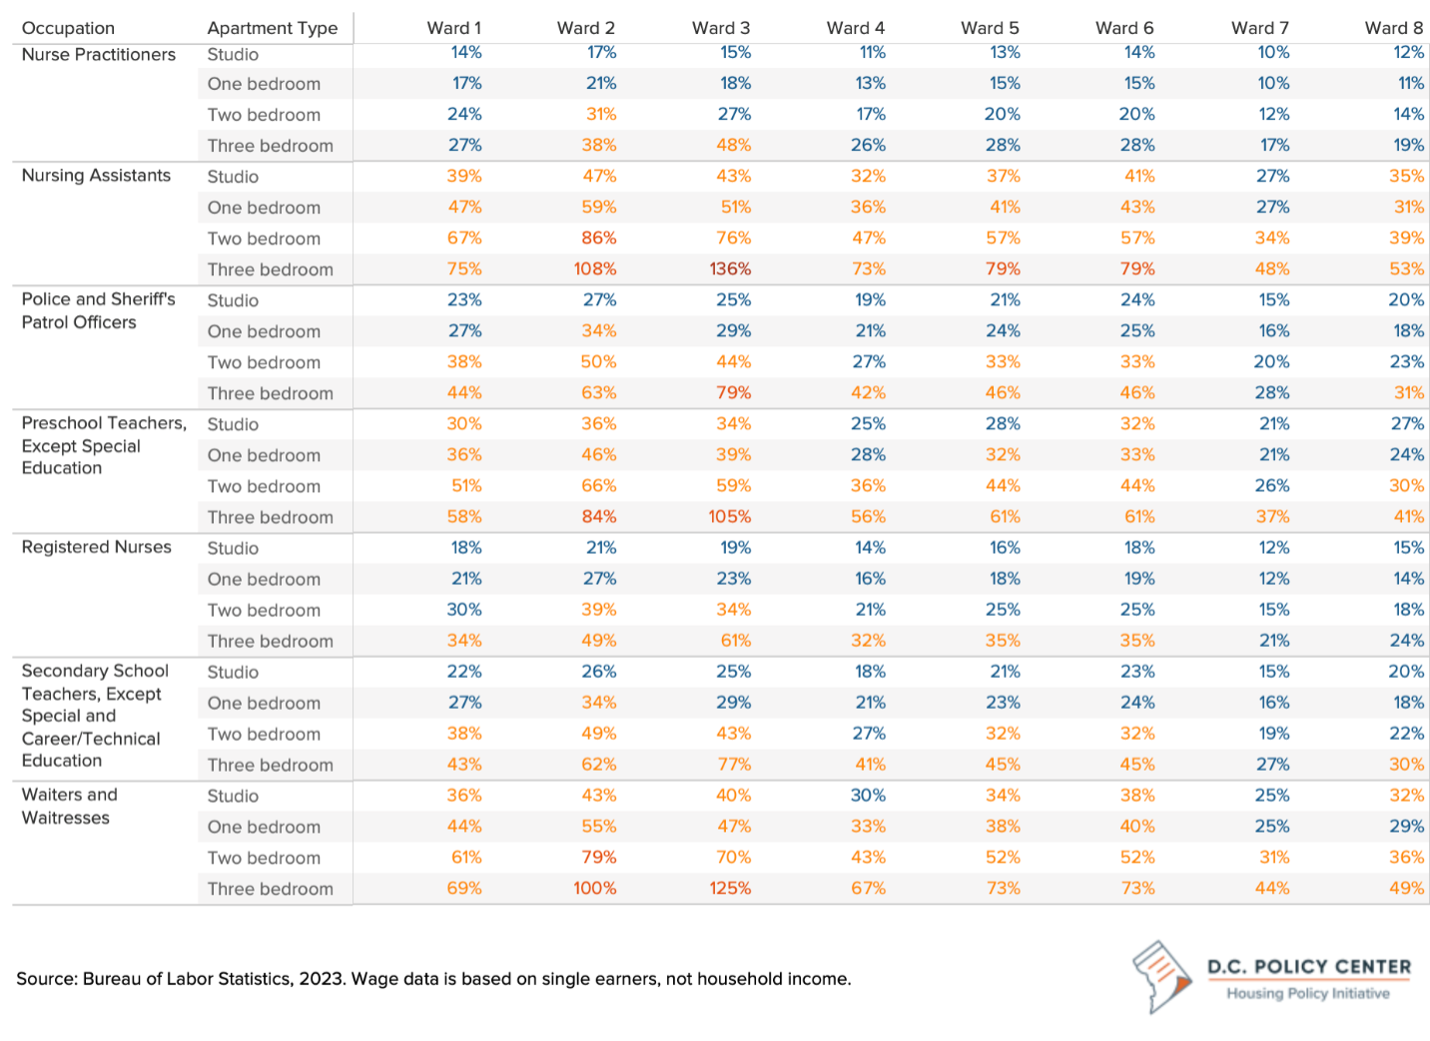
For most hotel and service industry occupations, health care support workers, and nursing assistants, a single essential worker is priced out of almost all apartment types across all wards, including studios. Most teachers and first responders (police and firefighters) can afford a studio apartment in most of D.C., but these occupations are priced out of one-bedroom units in the most expensive wards (Wards 2 and 3), even assuming a household with two wage earners.
Average rents by apartment type and ward
Pre-school teachers and childcare workers are priced out of studios across nearly the entire city. They can likely afford one- and two-bedroom apartments with a second income from a partner or family member, but they are again priced out of almost all three-bedroom apartments citywide.34 In the healthcare industry, entry-level workers like nursing assistants would be rent-burdened across nearly the entire city, while registered nurses and nurse practitioners could afford to live in one-bedroom apartments in most areas. (For the percentages of a worker’s salary each apartment would require by type and ward, see Appendix tables.)
Subsidized housing alone cannot solve the affordability problem for essential workers
While housing affordability is a major topic of policy interest in the District, the policy conversations are more often focused on subsidized affordability, targeting households with incomes at or under 80 percent of AMI. However, data suggest that serving these households only through subsidized housing is not feasible.
The District has developed many programs ranging from capital subsidies for affordable housing production and preservation to inclusionary zoning and rent subsidies such as vouchers and rent supplements.35 These programs, along with federal subsidies, collectively subsidize approximately 48,500 units.36 In comparison, of the 187,998 renter households in the District, an estimated 106,600 households (or 57 percent of all renter households) have an annual income below 80 percent of AMI.37 That means the District’s current affordable housing stock can accommodate only 45 percent of these households. And essential workers who are renters are only about 20 percent of these households and will likely not be prioritized in distribution of subsidized housing.
D.C. renter households and essential worker renter households by income group

While the District’s investments in subsidized affordable housing are substantial, these programs are not always efficient for supporting rent-burdened households, including essential workers. Projects receiving capital subsidies through the Housing Production Trust Fund, HUD loans, or Low-Income Housing Tax Credits (LIHTC) require complex financing and numerous requirements. Developers using these subsidies, whether for-profit or non-profit, must navigate extensive government requirements and legal, accounting, and compliance work, adding time and cost. Project selection often depends on political support, causing delays. Additionally, the concentration of subsidized projects in low-cost areas perpetuates segregation; half of the subsidized units are in the two wards with the highest family poverty rates.38
How can the District’s housing market be more welcoming to essential workers?
High housing costs have always been a major factor driving residents out of the District. Historically, people moved to D.C. for jobs and left for more affordable housing.39 One reason for high housing costs is the difficulty of building density in many areas of the District zoned for residential use. Single-family zoning occupies 13.2 square miles, or about 20 percent of the District’s surface area, and 74 percent of all residential tax lots, including apartments, condos, and cooperatives (17.2 square miles).40 High construction costs, an unpredictable permitting process, and the Height Act, which limits building density, further drive up housing costs and reduce the District’s competitiveness in retaining residents and workers.41
To make housing more affordable and welcoming to essential workers and other households, the District must focus on increasing housing supply, densifying neighborhoods, and building for all income levels. This requires more lenient zoning, a smoother permitting process, and programs aligned with the District’s economic development needs. Housing affordability is increasingly crucial for attracting and retaining residents and workers, making it arguably the District’s most important economic development policy.
An underexplored aspect of housing is the employers’ interest in having essential workers living nearby. Employers benefit from access to local workers and should be part of housing policies that promote affordability. They can be motivated to participate in efforts to create affordable housing for essential workers.
To this end, the D.C. Policy Center is developing an affordable housing model called inclusionary conversions. This model aims to efficiently and affordably create housing units in high-cost areas where government-funded affordable housing has been difficult to produce, primarily through employer engagement. This approach can create units at a fraction of the cost and time of traditional programs by replacing complicated financial transactions with leases and contracts. The main target for this model is workforce housing, such as for teachers, childcare workers, and healthcare workers, but it can also be applied to create affordable housing at various affordability levels.
The next report in this series will describe the inclusionary conversions model.
Appendix
Average rent as a percentage of average income for one worker, by occupation, apartment type and Ward, part 1
Average rent as a percentage of average income for one worker, by occupation, apartment type and Ward, part 2
Average rent as a percentage of average income for one worker, by occupation, apartment type and Ward, part 3
Methodology
For the estimates of the percent of D.C. workers and essential workers who can afford to live in D.C., we assumed that a single household would occupy a studio apartment, a two person household would occupy a one bedroom apartment, a three person household would occupy a two bedroom apartment, and a four person household would occupy a three bedroom apartment.
For household sizes and incomes of all workers, we used 2022 five-year PUMA data from the American Community Survey (ACS). For the household sizes and incomes of essential workers, we were not able to estimate rent burdens for all occupations due to the size of the standard errors. We assumed rents would be affordable if they were under 30 percent of estimated household income for the corresponding apartment size.
Salary data from the Bureau of Labor Statistics is often more accurate than ACS data for single workers. However, as only 17 percent of essential workers lived alone, we used ACS household income data to determine whether workers in essential worker occupations would be priced out of D.C.
Data Notes
The American Community Survey (ACS)
ACS data uses the five-year and single year estimates for 2022. Summary estimates are based on the weighted data and contain the corresponding standard errors calculated on a 95 percent confidence interval. ACS data was used to compile profiles on family size, household income, and household type for the different occupations used in our analysis. We collected data for the entire region (D.C., Maryland, Virginia) but only used data for those who had a place of work noted as the District in our final analysis. Therefore, someone who lives in D.C. but works outside of the city is not included. However, someone who lives in VA but works in D.C. is included.
Variables used in analysis:
- POWSP (Place of work)
- NP (Number of persons)
- HHT (Household type)
- OCCP (Occupation)
- HINCP (Household income)
- POWSP (State code)
- JWTRANS (Means of transportation to work)
- TEN (Tenure or renter status)
Occupations used in analysis:
- CMS-Educational, Guidance, and Career Counselors and Advisors
- EAT-Bartenders,
- EAT-Chefs and Head Cooks
- EAT-Cooks
- EAT-Dining Room and Cafeteria Attendants and Bartender Helpers
- EAT-Dishwashers
- EAT-First-Line Supervisors of Food Preparation and Serving Workers
- EAT-Food Preparation Workers
- EAT-Hosts and Hostesses, Restaurant, Lounge, and Coffee Shop
- EAT-Waiters and Waitresses
- EDU-Elementary and Middle School Teachers
- EDU-Other Educational Instruction and Library Workers
- EDU-Other Teachers and Instructors
- EDU-Postsecondary Teachers
- EDU-Preschool and Kindergarten Teachers
- EDU-Secondary School Teachers
- EDU-Special Education Teachers
- EDU-Teaching Assistants
- HLS-Nursing Assistants
- HLS-Other Healthcare Support Workers
- MED-Nurse Practitioners, and Nurse Midwives
- MED-Registered Nurses
- MGR-Education and Childcare Administrators
- OFF-Hotel, Motel, and Resort Desk Clerks
- PRS-Baggage Porters, Bellhops, And Concierges
- PRS-Childcare Workers
- PRT-Firefighters
- PRT-First-Line Supervisors of Firefighting and Prevention Workers
- PRT-First-Line Supervisors of Police and Detectives
- PRT-Police Officers
CoStar
Multifamily rental data from CoStar was collected on June 18th, 2023. Ward level analysis using CoStar was done by first creating a point layer by geocoding the addresses in the D.C. region and then creating a spatial join between this new point layer and the 2022 Ward Boundary shapefile available on Open Data DC.
Variables used in analysis:
- Property Address
- Market Name
- Submarket Name
- State
- Zip Code
- Effective Rent per Unit (for studios, one bedrooms, two bedrooms, and three bedrooms)
- Number of Units (for studios, one bedrooms, two bedrooms, and three bedrooms)
Bureau of Labor Statistics (BLS); Occupational Employment and Wage Statistics (OEWS)
Data was collected from OEWS on June 20th, 2024 and was used primarily to build our model.
Occupations of interest (and corresponding SOC code):
- Educational Instruction and Library Occupations (250000)
- Preschool Teachers, Except Special Education (252011)
- Kindergarten Teachers, Except Special Education (252012)
- Elementary School Teachers, Except Special Education (252021)
- Middle School Teachers, Except Special and Career/Technical Education (252022)
- Secondary School Teachers, Except Special and Career/Technical Education (252031)
- Registered Nurses (291141)
- Nurse Practitioners (291171)
- Nursing Assistants (311131)
- Healthcare Support Workers, All Other (319099)
- First-Line Supervisors of Police and Detectives (331012)
- Firefighters (332011)
- Police and Sheriff’s Patrol Officers (333051)
- Cooks, Restaurant (352014)
- Food Preparation Workers (352021)
- Bartenders (353011)
- Waiters and Waitresses (353031)
- Dishwashers (359021)
- Hosts and Hostesses, Restaurant, Lounge, and Coffee Shop (359031)
- Maids and Housekeeping Cleaners (372012)
- Baggage Porters and Bellhops (396011)
- Concierges (396012)
- Hotel, Motel, and Resort Desk Clerks (434081)
OEWS and the ACS do not track occupation titles the same and as such there are differences in occupational titles between the two datasets. We matched the occupations between the two datasets to the best of our ability based on their respective titles.
Variable of interest:
- Annual median wage
- Annual mean wage
- Employment
Works Cited
Aaron, S., & Gaitan, V. (2019). Four Reasons Why Employers Should Care about Housing. Housing Matters an Urban Institute. https://housingmatters.urban.org/articles/four-reasons-why-employers-should-care-about-housing.
Anthony, J. (2022). Housing Affordability and Economic Growth. Housing Policy Debate, 33(5), 1187–1205. https://doi.org/10.1080/10511482.2022.2065328
Barnow, B. S., Trutko, J., & Piatak, J. S. (2023). Occupational Labor Shortages : Concepts, Causes, Consequences, and Cures. W.E. Upjohn Institute for Employment Research .
Brooks, L. & Schuetz, J. (2023) Where 20 years of new housing was built in Washington, DC—and where it wasn’t. The Brookings Institution. https://www.brookings.edu/articles/where-20-years-of-new-housing-was-built-in-washington-dc-and-where-it-wasnt/
Boushey, H. and Glynn, S.J. (2012). There are significant business costs to replacing employees. Center for American Progress. https://www.americanprogress.org/article/there-are-significant-business-costs-to-replacing-employees/
Chatterjee, K., Clark, B., Davis, A., Toher, D., & Martin, A. (2017). The Commuting and Wellbeing Study: Understanding the Impact of Commuting on People’s Lives. UWE Bristol.
Clark, B., Chatterjee, K., Martin, A. et al. How commuting affects subjective wellbeing. Transportation 47, 2777–2805 (2020). https://doi.org/10.1007/s11116-019-09983-9
Coffin, C. and Mason, H. (2024) Early childhood educators in D.C. and housing: Part II, Where do early childhood educators live? D.C. Policy Center. https://www.dcpolicycenter.org/publications/early-childhood-educators-in-d-c-and-housing-part-ii-where-do-early-childhood-educators-live-part-ii/
Frey, B., & Stutzer, A. (2004). Stress that Doesn’t Pay: The Commuting Paradox. The Institute for the Study of Labor; Discussion Paper Series. https://docs.iza.org/dp1278.pdf
Friedline, T., Chen, Z., & Morrow, S. (2021). Families’ Financial Stress & Well-Being: The Importance of the Economy and Economic Environments. Journal of family and economic issues, 42 (Suppl 1), 34–51. https://doi.org/10.1007/s10834-020-09694-9
Gimenez-Nadal, I., & Molina, J. (2014). Daily feelings of US workers and commute time. Journal of Transport and Health, volume 12, 21-33. https://www.bc.edu/content/dam/bc1/schools/mcas/economics/pdf/working-papers/wp967.pdf
Gimenez-Nadal, J.I., Molina, J.A. & Velilla, J. (2022). Commuting time and sickness absence of US workers. Empirica 49, 691–719. https://doi.org/10.1007/s10663-022-09534-z
Grissom, J. A., & Santelli, F. A. (2022). A Bad Commute: Does Travel Time to Work Predict Teacher and Leader Turnover and Other Workplace Outcomes? EdWorkingPapers. https://www.edworkingpapers.com/ai22-691#:~:text=Research%20suggests%20that%20longer%20commute,reducing%20job%20attachment%20and%20embeddedness
Grissom, J. A., & Santelli, F. A. (2015). The growing distance between people and jobs in metropolitan regions. Metropolitan Policy Program at Brookings Institute. https://www.brookings.edu/wp-content/uploads/2016/07/srvy_jobsproximity.pdf
Kneebone, E., & Holmes, N. (2015). The growing distance between people and jobs in metropolitan regions. Brookings Institute. https://www.brookings.edu/wp-content/uploads/2016/07/srvy_jobsproximity.pdf
Ma, L., & Ye, R. (2019). Does daily commuting behavior matter to employee productivity? Journal of Transport Geography, 130-141.
McAnaney, P. (2024). How federal stimulus accidentally bottlenecked affordable housing in DC. Greater Greater Washington. https://ggwash.org/view/93101/how-federal-stimulus-accidentally-bottlenecked-affordable-housing-in-dc
McCabe, B. (2021). The Housing Production Trust Fund, explained. Greater Greater Washington. https://ggwash.org/view/80343/what-is-the-housing-production-trust-fund-anyway#:~:text=A%20recent%20report%20from%20the,historically%20have%20seen%20less%20investment.
Nichols, A., Mitchell, J., & Lindner, S. (2013). Consequences of Long-Term Unemployment. Urban Institute. https://www.urban.org/sites/default/files/publication/23921/412887-Consequences-of-Long-Term-Unemployment.PDF
Oguz, S. (2014). Commuting and Personal Well-being. Office of National Statistics. https://www.researchgate.net/publication/271191327_Commuting_and_Personal_Well-being_2014
Rusnak, J. (2016). The Address Effect: Why it Matters Where Your Employees Live. LinkedIn. https://www.linkedin.com/pulse/address-effect-why-matters-where-your-employees-live-jason-rusnak/
Santelli, F. and Grissom, J. (2022). A Bad Commute: Does Travel Time to Work Predict Teacher and Leader Turnover and Other Workplace Outcomes?. (EdWorkingPaper: 22-691). Annenberg Institute at Brown University. https://doi.org/10.26300/dzcj-wg46
Sayin, Y. (2020). Appraising the District’s rentals. D.C. Policy Center. https://www.dcpolicycenter.org/publications/appraising-districts-rentals/
Sayin, Y. (2015). Residents move in the city for jobs, move out for housing. District Measured. https://ora-cfo.dc.gov/blog/residents-move-city-jobs-move-out-housing
Saying, Y. (2019). Single-family zoning and neighborhood characteristics in the District of Columba. D.C. Policy Center. https://www.dcpolicycenter.org/publications/single-family-zoning-2019
Sayin, Y. (2018) Taking Stock of the District’s Housing Stock: The Full Report. D.C. Policy Center. https://www.dcpolicycenter.org/publications/taking-stock-full-report/
Sayin, Y. (2019). The economic cost of land use regulations. D.C. Policy Center. https://www.dcpolicycenter.org/publications/economic-cost-land-use/
Stacy, C., Meixell, B., & Serena, L. (2019). Too Far from Jobs: Spatial Mismatch and Hourly Workers. Urban Institute. https://www.urban.org/features/too-far-jobs-spatial-mismatch-and-hourly-workers
Endnotes
- Data from OSSE. For details, see Coffin & Mason (2024) “Early Childhood Educators in D.C. and Housing: Part II, Where do early childhood educators live?” Available at https://www.dcpolicycenter.org/publications/early-childhood-educators-in-d-c-and-housing-part-ii-where-do-early-childhood-educators-live-part-ii/
- These numbers use data from two different sources to estimate the share of workers who work in the city and live in the city for a given occupation. The number of workers working in the city in each occupation is from the May Occupational Estimates from Bureau of Labor Statistics. The number of workers who are in a given occupation and who live and work in the District of Columbia are obtained from the American Community Survey.
- Using the American Community Survey Single-year PUMS data, we estimate that of the 551,610 workers who work in D.C. at their place of work (and not working from home) 44 percent lived outside of the District of Columbia.
- This estimate is based on 81,670 workers in 30 essential worker occupations from single year 2022 ACS data. A list of all included occupations can be found in the appendix.
- Employment and wage data come from the Bureau of Labor Statistics, 2023. A list of all included occupations can be found in the appendix. BLS classification of occupations is slightly different from ACS classification. The estimated number of essential workers according to ACS was 85,112 in 2022.
- This estimate reflects 2022 1 year samples from the American Community Survey. Another estimate from the Bureau of Labor Statistics shows 104,710 essential workers in the District.
- This estimate is from the 2022 American Community Survey single year PUMS data. Adjusted for inflation, the 2023 equivalent would have been approximately $111,730.
- Estimated using the American Community Survey PUMS single year 2022 data.
- Estimated using the American Community Survey PUMS single year 2022 data.
- Oguz, S. (2014). Commuting and Personal Well-being. Office of National Statistics. https://www.researchgate.net/publication/271191327_Commuting_and_Personal_Well-being_2014
- Clark, B., Chatterjee, K., Martin, A., & Davis, A. (2019). How commuting affects subjective wellbeing. Transportation.
- Aaron, S., & Gaitan, V. (2019). Four Reasons Why Employers Should Care about Housing. Retrieved from Housing Matters an Urban Institute Initiative: https://housingmatters.urban.org/articles/four-reasons-why-employers-should-care-about-housing.
- Oguz, S. (2014). Commuting and Personal Well-being. Office of National Statistics. https://www.researchgate.net/publication/271191327_Commuting_and_Personal_Well-being_2014
- Clark, B., Chatterjee, K., Martin, A. et al. How commuting affects subjective wellbeing. Transportation 47, 2777–2805 (2020). https://doi.org/10.1007/s11116-019-09983-9
- Gimenez-Nadal, I., & Molina, J. (2014). Daily feelings of US workers and commute time. Journal of Transport and Health, volume 12, 21-33. https://www.bc.edu/content/dam/bc1/schools/mcas/economics/pdf/working-papers/wp967.pdf
- Common problems include anxiety, mood swings, fatigue, eating problems, depression, rise in blood pressure, change in sleep habits, or headaches.
- Bureau of Labor Statistics May Occupational estimates for Washington D.C. and Washington metropolitan area. The numbers compare median annual wages for the given occupations.
- Stacy, C., Meixell, B., & Serena, L. (2019, 2 21). Too Far from Jobs: Spatial Mismatch and Hourly Workers . https://www.urban.org/features/too-far-jobs-spatial-mismatch-and-hourly-workers
- The data has employment for teachers and principals between the 2008-2009 and 2019-2020 school years. Turnover rates are from one year to another. Santelli, F. and Grissom, J. (2022). A Bad Commute: Does Travel Time to Work Predict Teacher and Leader Turnover and Other Workplace Outcomes? (EdWorkingPaper: 22-691). Annenberg Institute at Brown University. https://doi.org/10.26300/dzcj-wg46
- Boushey, H. and Glynn, S.J. (2012). There are significant business costs to replacing employees. Center for American Progress. https://www.americanprogress.org/article/there-are-significant-business-costs-to-replacing-employees
- Grissom, J. A., & Santelli, F. A. (2022). A Bad Commute: Does Travel Time to Work Predict Teacher and Leader Turnover and Other Workplace Outcomes? EdWorkingPapers. https://www.edworkingpapers.com/ai22-691#:~:text=Research%20suggests%20that%20longer%20commute,reducing%20job%20attachment%20and%20embeddedness; Ma, L., & Ye, R. (2019). Does daily commuting behavior matter to employee productivity? Journal of Transport Geography, 130-141
- These costs include sick time pay, overtime pay for coverage, dip in quality of goods and services due to understaffing, reduced productivity, and low employee morale.
- Anthony, J. (2022). Housing Affordability and Economic Growth. Housing Policy Debate, 33(5), 1187–1205. https://doi.org/10.1080/10511482.2022.2065328
- Kneebone, E., & Holmes, N. (2015). The growing distance between people and jobs in metropolitan regions. Brookings Institute. https://www.brookings.edu/wp-content/uploads/2016/07/srvy_jobsproximity.pdf
- Nichols, A., Mitchell, J., & Lindner, S. (2013). Consequences of Long-Term Unemployment. Urban Institute. https://www.urban.org/sites/default/files/publication/23921/412887-Consequences-of-Long-Term-Unemployment.PDF
- Barnow, Trutko, & Piatak, 2023
- D.C. Policy Center Business Sentiments Survey, 2024 Q 2.
- Sayin, Y. (2019). The economic cost of land use regulations. D.C. Policy Center. https://www.dcpolicycenter.org/publications/economic-cost-land-use/
- Sayin, Y. (2018). Taking Stock of District’s Housing Stock. D.C. Policy Center. https://www.dcpolicycenter.org/publications/taking-stock/
- Estimated in 2024 by researchers at Howard University Center of Excellence in Housing & Urban Research & Policy (CHURP).
- Sayin, Y. (2020). Appraising the District’s rentals. D.C. Policy Center. https://www.dcpolicycenter.org/publications/appraising-districts-rentals/
- Brooks, L. & Schuetz, J. (2023) Where 20 years of new housing was built in Washington, DC—and where it wasn’t. The Brookings Institution. https://www.brookings.edu/articles/where-20-years-of-new-housing-was-built-in-washington-dc-and-where-it-wasnt/
- Friedline, T., Chen, Z., & Morrow, S. (2021). Families’ Financial Stress & Well-Being: The Importance of the Economy and Economic Environments. Journal of family and economic issues, 42(Suppl 1), 34–51. https://doi.org/10.1007/s10834-020-09694-9
- 37 percent of early childhood educators live in Maryland. For early childhood educators who live in D.C., most live in Wards 4, 7, and 8. Coffin, C. and Mason, H. (2024) Early childhood educators in D.C. and housing: Part II, Where do early childhood educators live? D.C. Policy Center. https://www.dcpolicycenter.org/publications/early-childhood-educators-in-d-c-and-housing-part-ii-where-do-early-childhood-educators-live-part-ii/
- Methods used by the District to create affordable housing include Housing Production Trust Fund, Inclusionary Zoning, Planned Use Developments, and Low-Income Housing Tax Credits. Methods the District uses to stabilize housing and rental prices include rent control, community land trusts, the Housing Choice Voucher program, Local Rent Supplement Program, public private partnerships such as projects with WMATA, and employer assisted housing programs including downpayment assistance and rental supplements.
- Data from Housing Insights (http://housinginsights.org/) last updated on April 19, 2024.
- Data from ACS 2022 PUMS analysis.
- McCabe, B. (2021). The Housing Production Trust Fund, explained. Greater Greater Washington. https://ggwash.org/view/80343/what-is-the-housing-production-trust-fund-anyway#:~:text=A%20recent%20report%20from%20the,historically%20have%20seen%20less%20investment.
- Sayin, Y. (2015). Residents move in the city for jobs, move out for housing. District Measured. https://ora-cfo.dc.gov/blog/residents-move-city-jobs-move-out-housing.
- Sayin, Y. (2019). Single-family zoning and neighborhood characteristics in the District of Columba. D.C. Policy Center. https://www.dcpolicycenter.org/publications/single-family-zoning-2019
- Sayin, Y. (2019). The economic cost of land use regulations. D.C. Policy Center. https://www.dcpolicycenter.org/publications/economic-cost-land-use/