A recent working paper released by the Washington Center for Equitable Growth (WCEG) —and covered by the Washington Post on July 2—found that Black and Hispanic homeowners pay a higher effective tax on their homes when compared to what white homeowners pay on comparable homes, because Black- and Hispanic-owned homes are assessed at higher values (relative to what these homes sell for). So even when Black and Hispanic homeowners pay the same tax rate as white homeowners, their real property tax burden would be a higher share of the market value of their homes.[1]
The study looked at home sales across many jurisdictions in the U.S. by race of the seller and found that:
“…[w]ithin the same tax jurisdiction, Black and Hispanic residents bear a 10–13% higher property tax burden than white residents.”
How could this be? Most jurisdictions value residential housing using computerized mass assessment systems. And assessors rarely visit homes or know the race of the homeowner. How, then, could the assessment process result in a dissimilar treatment of owners of different racial and ethnic backgrounds?
The WCEG study authors offer two potential reasons why this might be the case. First, they note that Black homeowners are less likely to appeal their tax assessments than white homeowners, and less likely to be successful when they do appeal. If white homeowners are more likely to successfully appeal their assessments, over time, a one-time reduction in the assessed value for white homeowners could lead to a substantial reduction in the tax assessments of their homes. This is because, as noted, most assessments are computerized, and without significant changes in market conditions, year-to-year changes in assessments can simply be a matter of increasing last year’s assessment by a certain percentage. So, a small disparity in values in the first year will be compounded over time to create large disparities.
The second reason the WCEG study offers to explain racial disparities is that tax assessments are not sensitive to neighborhood amenities. While computerized assessments are good at valuing similarly-constructed homes (quality of the construction, number of bedrooms or fireplaces, etc.), they are not good at valuing neighborhood amenities like good schools, access to retail, or transportation. On the other hand, sale prices of homes are extremely sensitive to these hyper-localized amenities. If Black and Hispanic homeowners are more likely to be in neighborhoods that lack such amenities, which in turn depresses their sales value, the ratio of their assessed home value to the market value would be higher.
From what we could tell, the WCEG study did not include the District of Columbia. With that in mind, the D.C. Policy Center asked, are Black- and Hispanic-owned homes assessed at higher values in the District, leading to a higher effective tax for Black and Hispanic homeowners?
Homebuyers of different races and ethnicities tend to be concentrated in certain parts of the city
The D.C. Policy Center obtained race and ethnicity information on homebuyers in the District.[2] These data show that of the 83,395 mortgage applications approved for the purchase of a owner-occupied homes in 1-4 unit buildings from 2007 to 2017, 4.8 percent were Hispanic or Latino, 14.8 percent were Black or African American, 55 percent were white, 22 percent had no reported information on the ethnicity of the applicant, and, measured separately, 25 percent had no information on the race of the applicant. White homebuyers were more concentrated west of Rock Creek Park and in and around Capitol Hill, while Black homeowners were more concentrated east of the Anacostia River and along the northeast boundary of the city. Hispanic and Latino homeowners were more concentrated along the city’s central corridor, between 16th Street and Georgia Avenue.
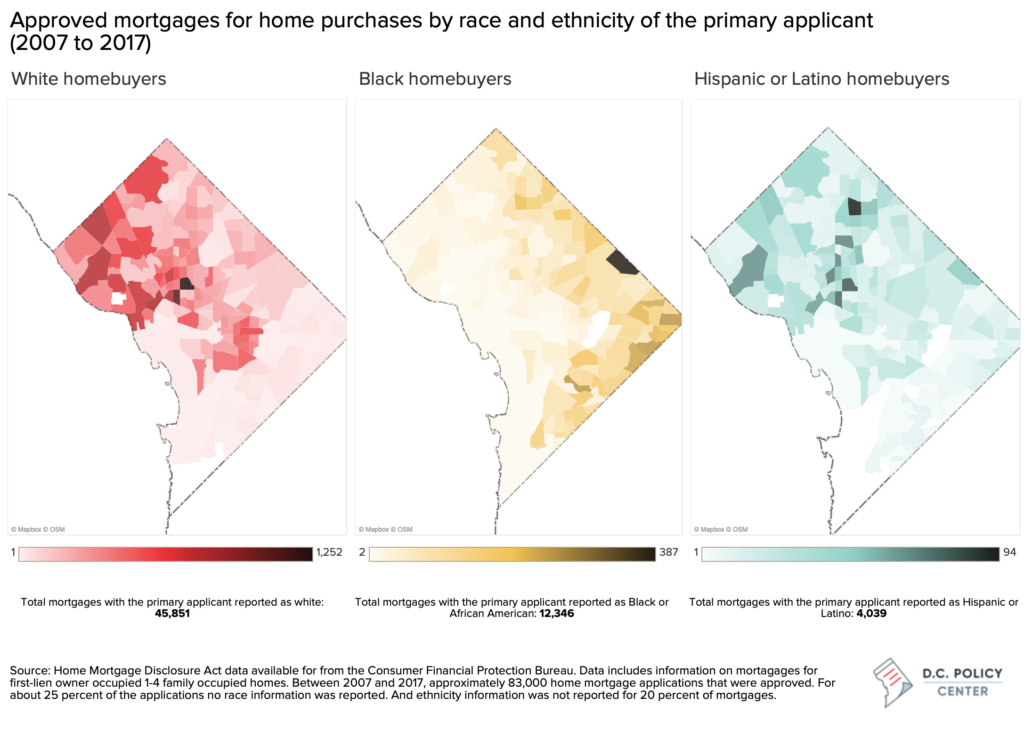
This information underscores two trends. First, a great majority of homebuyers in the District of Columbia are white. Second, they tend of be concentrated in parts of the city where amenities are generally considered superior (and prices, generally higher). If the assessment process—as the authors of the WCEG report postulate—are not responsive to these amenities, we should find a higher assessment penalty for non-white homeowners, just like the WCEG study.
This information by itself is not enough to replicate the analysis conducted by WCEG authors. That paper uses information from a proprietary data source to match home sales to assessed values and make inferences about the “race penalty” by looking at the underlying characteristics of the neighborhood at the census tract level. We do not have access to this information to replicate the study for the District of Columbia. However, we do know the ratio of tax assessments to sale values by tax assessment neighborhood, as well as the demographic characteristics of homeowners within those neighborhoods. Using this information, we present here a simplified analysis to determine if assessment neighborhoods with majority Black homeownership faced higher assessment values relative to the market value, as compared to neighborhoods with majority white ownership.
Homes in D.C.’s majority Black neighborhoods do not appear to have higher property assessment values compared to their market value.
At the neighborhood level, we could not find any evidence that neighborhoods comprised of predominantly Black homeowners face a “tax penalty.” In fact, assessment-to-market-value ratios decline as the share of Black homeowners increases in tax assessment neighborhoods. However, this relationship is not strong enough in magnitude to make any reliable inferences.
Residential property in D.C. is assessed at its full market value, or the assessors’ best estimate of what it would sell for on the open market.[3] The District’s Office of Tax and Revenue (OTR) determines the assessed value of properties annually within the District’s 56 residential tax assessment neighborhoods. These assessments do not typically involve physical inspections of the property, but instead use mass appraisal techniques that rely on market data, among other factors. If homeowners believe the property was valued incorrectly, they may appeal the assessment. As the assessed value of properties are meant to equal the market value, homeowners are taxed a proportion of the value of the property each year.
Assessment to market value reports
To check whether the assessment system produces assessments reflecting the market value of homes, OTR’s Real Property Tax Administration (RPTA) annually reviews properties that have been appraised and sold in order to produce an assessed value-to-sale price ratio, called the assessment-to-market ratio, for each tax assessment neighborhood. The latest of these reports is for the 2020 tax year.
Beginning late 2019, OTR assessed 207,400 residential properties (excluding multifamily apartment buildings). OTR also had sales information from 7,598 verified arms-length transactions from calendar year 2018, which they used to compare assessed values to market values. By focusing exclusively on arms-length transactions, OTR’s analysis eliminates sales between related parties, purchases to or from financial institutions and government agencies, and sales with “extreme ratios” or abnormal transactions. Based on this information, OTR finds that the median assessment-to-market ratio varies between 92.7 percent (SW Waterfront) and 101.1 percent (North Cleveland Park), and that the average assessment-to-market ratio varies between 94.7 percent (Wesley Heights) and 101 percent (North Cleveland Park). Because OTR relies on statistical inferences, these calculations are more meaningful in neighborhoods where many homes were sold.[4]

Homeowner characteristics
To determine if there is a relationship between homeowner characteristics and assessment-to-market ratios, the D.C. Policy Center compared assessment-to-market ratios to the demographic makeup of homeowners in each of D.C.’s tax assessment neighborhoods. We built population demographics of homeowners by taking a weighted average of information from the census block groups (the smallest unit of publicly available Census data) that fall into each tax assessment neighborhood. When census block groups spanned across neighborhood borders, we allocated the census block group to the neighborhood that contains the centroid of the block group.
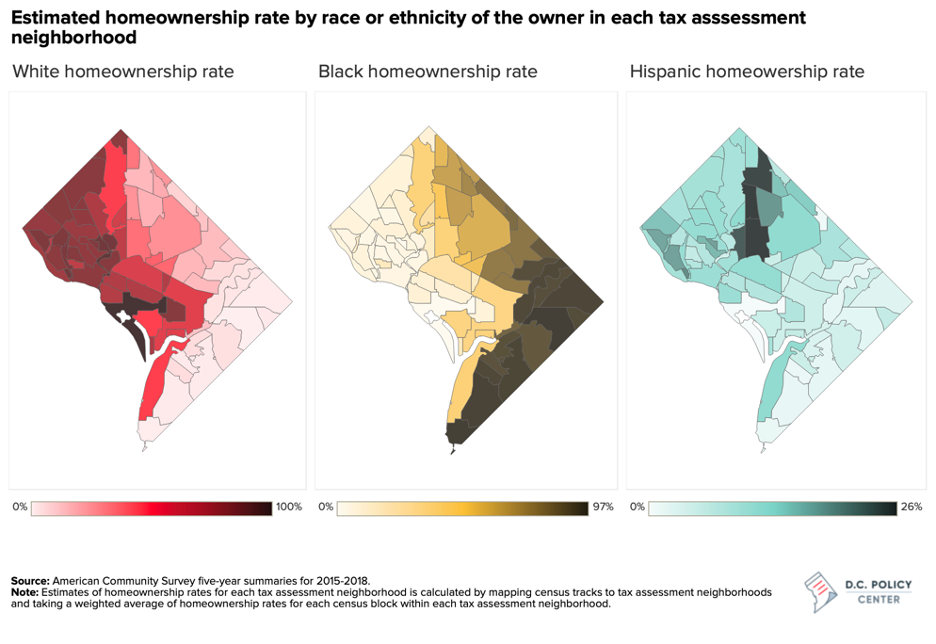
Our analysis used both the share of homeowners in each assessment neighborhood by race and the share of population in a given neighborhood by race. Below, we report our findings for homeownership demographics, but the results are similar when we use the population shares.
Racial makeup of owners cannot explain variation in assessment-to-market ratios
If Black or Hispanic homeowners in the District face higher assessment values as compared to market rate than their white peers, keeping everything else constant, we would expect to see higher assessment-to-market ratios in neighborhoods with majority Black or Hispanic homeowners.
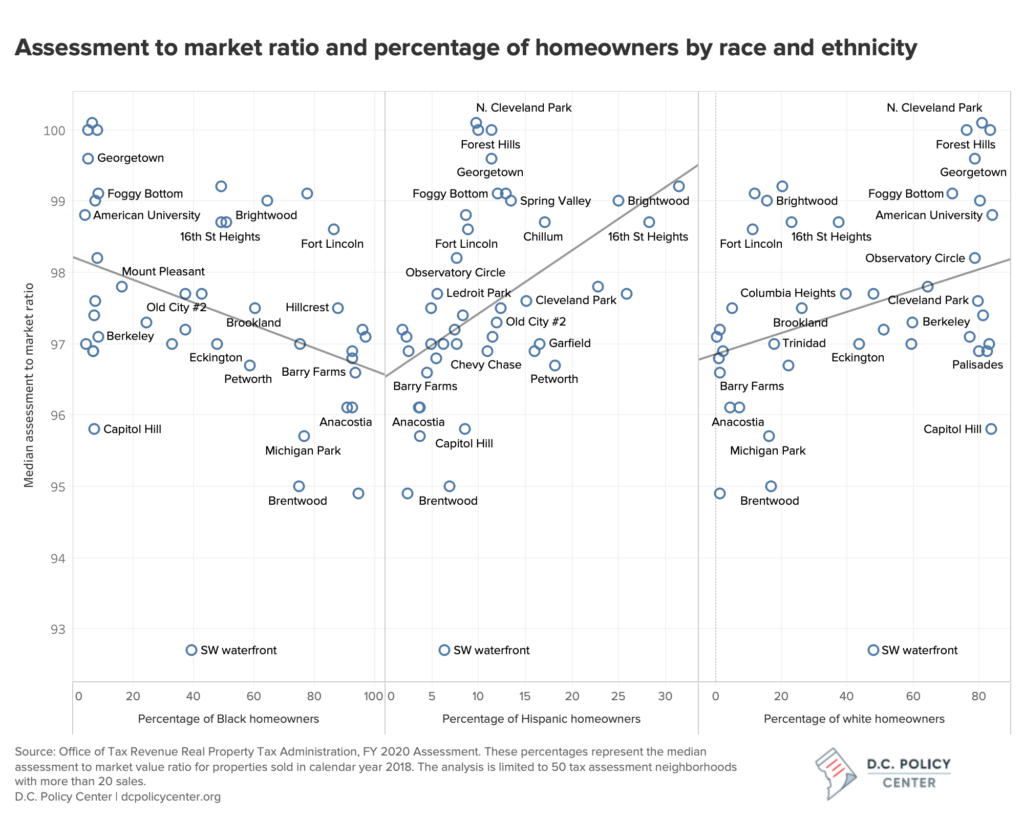
There is not a statistically meaningful relationship between high property assessment-to-market ratios and the percentage of homeowners who are Black.
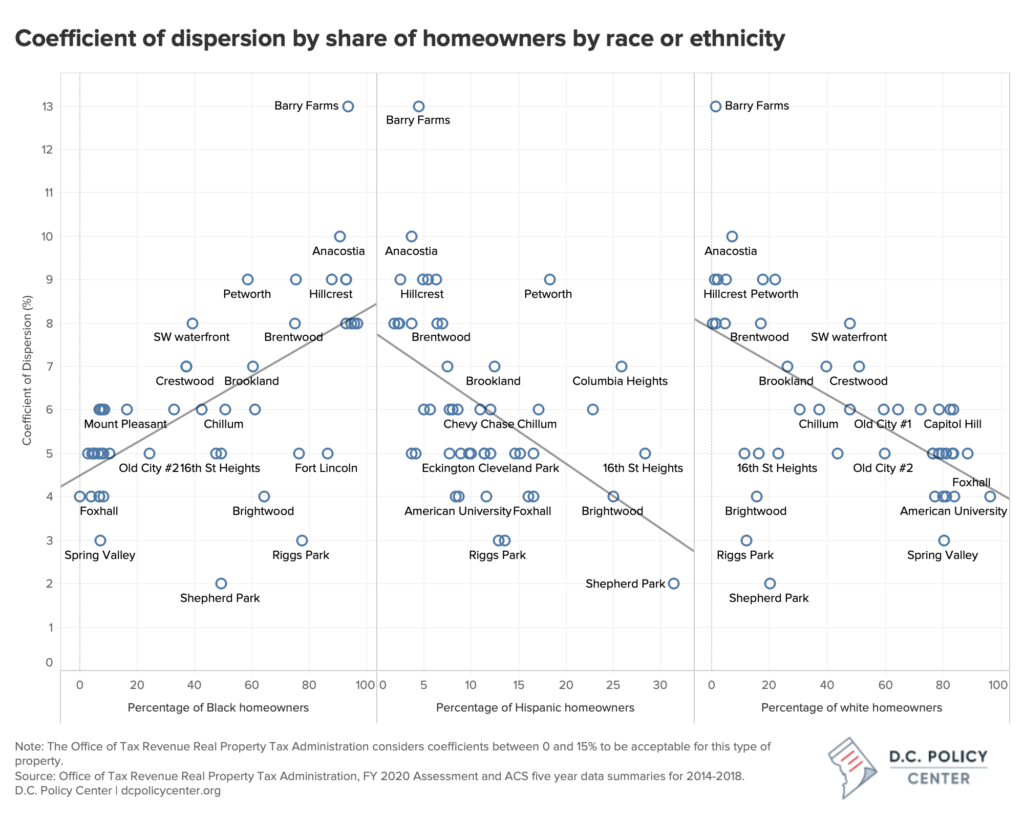
Our analysis of tax assessment neighborhoods shows that neighborhoods with the highest concentrations of Black homeowners do not have the highest assessment-to-market ratios. In fact, there is a weak negative relationship between assessment-to-market ratios and percentage of homeowners who identify as Black in this analysis. A simple regression analysis finds that a one percentage point increase in the share of Black-owned homes is associated with 1.16 percentage point decrease in the assessment-to-market ratios. This means that homeowners in tax assessment neighborhoods with majority Black homeownership generally have a lower assessment-to-market ratio than homeowners living in neighborhoods with majority white homeownership. This implies that Black homeowners do not have a disproportionate tax burden in the District, refuting the trend found in the WCEG study. However, the D.C. Policy Center’s proposed model can only explain 14 percent of the variation in assessment-to-market ratios. Similarly, there is a weak relationship between the share of white homeowners and assessment-to-market ratios, with the model explaining 10 percent of the variation.
In the District, homes sold in tax assessment neighborhoods with higher percentages of Black residents tend to have assessments that vary more from sales prices.
One potential factor obfuscating trends in real property taxes paid, is that more variation exists in assessment-to-market ratios of homes sold in tax assessment neighborhoods where a larger share of homes are owned by Black residents. OTR calculates a measure of variation in the assessment values relative to sale price, called the coefficient of dispersion.[5] In neighborhoods where the coefficient of dispersion is low, the difference between the assessed value and the median sales price in that neighborhood tends to be smaller. For residential properties in D.C., variation under 15 percent is considered acceptable.
There is a statistically significant positive relationship between percentage of homeowners in the tax assessment neighborhood who identify as Black, and the coefficient of dispersion. That is, where a larger share of homes are owned by Black residents, there tends to be more variation between assessed values and sales price. This could be a marker of gentrification if neighborhoods with a large share of Black homeowners are attracting buyers who are willing and able to pay more than historically observed prices (which are included in assessments).
Are assessment values in D.C. insensitive to neighborhood characteristics?
The WCEG research suggests that tax assessment practices are insensitive to hyper-local characteristics (such as school quality or access to retail) that homeowners and buyers value. The authors of the WCEG study recommend that some of the racial inequities observed in their analysis can be addressed by ensuring that assessment processes incorporate neighborhood level characteristics that are correlated with the race and ethnicity of homeowners.
To the extent that assessors frequently compare their assessment values to the actual sale prices and incorporate this information to their assessments, the assessment system iteratively integrates hyper-localized differences in how homes are valued by potential buyers, including the presence of amenities. For example, in a city where assessors increase tax assessments across the board by a certain percentage each year over time, home values will diverge across neighborhoods with different amenities, but assessment values will still be similar. In contrast, in a city where assessors frequently incorporate home values to their assessments, similar homes in neighborhoods with disparate amenities will have disparate valuations.
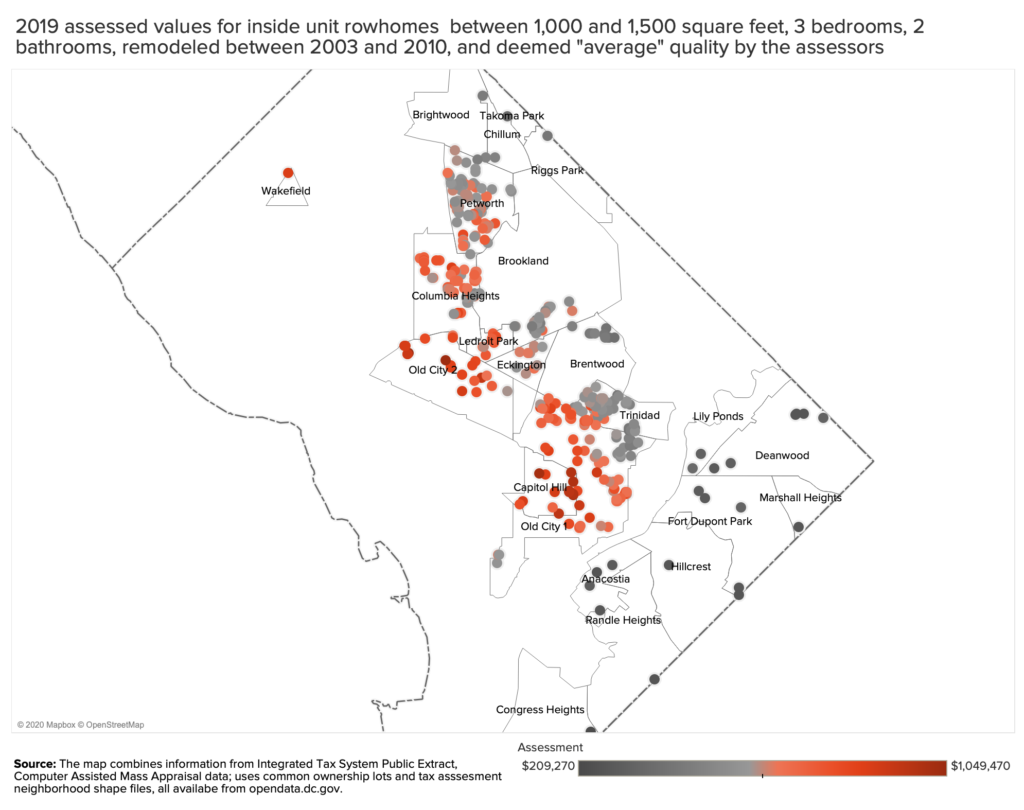
To see if assessed values in D.C. incorporate neighborhood amenities in addition to physical characteristics of homes, the D.C. Policy Center looked at the assessed values of a narrow set of homes in the District that share similar characteristics. Specifically, we looked at homes sold in 2019 that are (a) inside-unit row homes; (b) between 1,000 and 1,500 square feet; (c) have three bedrooms and two bathrooms; (d) have been remodeled between 2003 and 2010; and (e) were deemed “average” quality with assessors. As shown in the map below, the values of these homes that share similar physical characteristics can be as low as $210,000 (Fort Dupont Park) and as high as $1.05 million (Old City). This suggests that property assessment values are generated by incorporating previous sales values.
The frequent incorporation of past sales values in assessments is one probable reason why we did not find an assessment system that penalizes Black or Hispanic homeowners. We think that since the District does not have a calculated rate like many other jurisdictions—that is the property tax rate is not adjusted as a matter of course to deliver a certain level of revenue—the assessments might be more aligned with market value in D.C. than in other jurisdictions.
This does not, however, mean that assessors always correctly predict the sales value. As we have shown, assessed values of similar homes vary greatly across neighborhoods. But within each neighborhood, some homes sell for less than their assessed value, and some sell for more. For the homes sold in 2019 (and limited to the group examined in the previous section), the assessment to market value ratios for these homes vary somewhere between 0.75 and 1.5, and as the below graph shows, there is quite a bit of dispersion within each neighborhood.
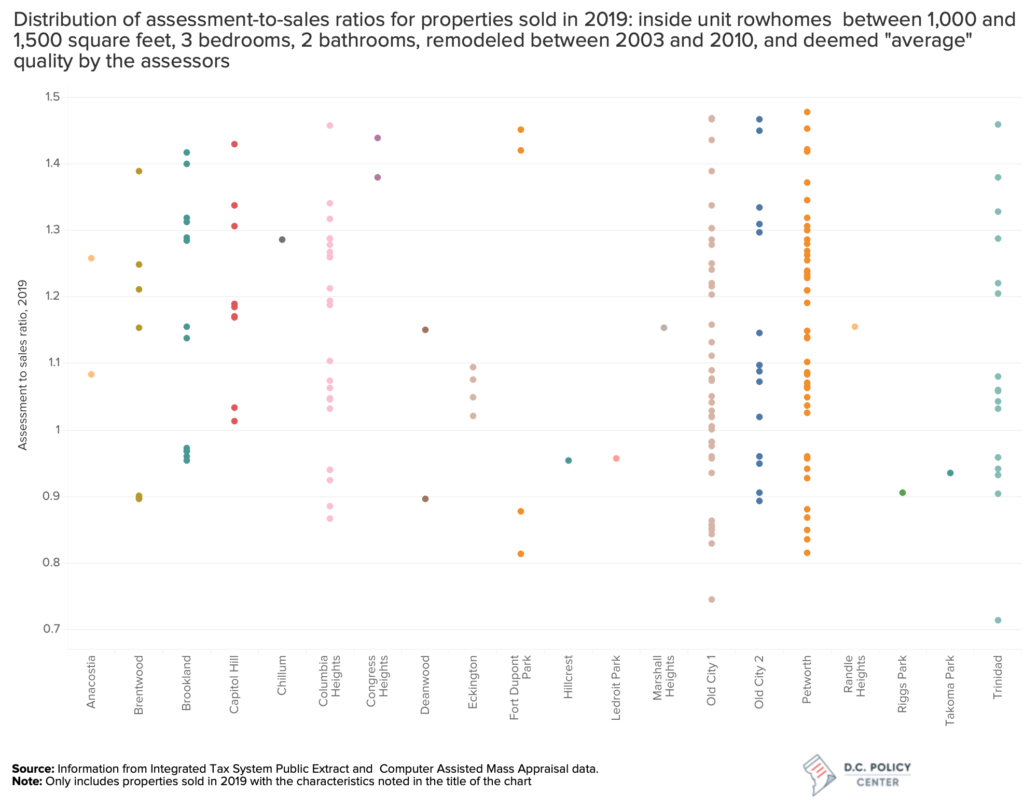
This suggests that computerized mass assessment systems will not always correctly capture a slew of characteristics buyers value in a house (things like layout, exposure, size of the yard, etc.). It also means that one should use caution when making inferences about biases in tax assessments, because they could simply be capturing some other underlying difference.
While there appears to be no race penalty in tax assessments in D.C., there are large discrepancies in home ownership and valuations
What we presented in this analysis is not a replication of the WCEG study, but our findings suggest that there is no race and ethnicity penalty in real property tax in D.C. However, there are disparities in home values and number of homebuyers in the District. Our analysis shows that:
- There is a great disparity in home purchases across residents of different races and ethnicity. Of the 89,000 mortgages approved between 2007 and 2017, we have information on the race of the applicant for 63,000 cases. Of this group, 73 percent are white, 20 percent are Black, and 6 percent are Latino.
- Similarly-sized and -constructed homes are assessed at much lower rates in neighborhoods where a larger share of the homes are owned by Black residents. These assessment values generally reflect market conditions, implying that homes in majority Black neighborhoods do not appreciate as much in value as homes in other neighborhoods.
- Assessment-to-market ratios have more variance in predominantly Black neighborhoods, suggesting that assessment values are more disconnected from sales values. When homes sell in neighborhoods with predominantly Black homeownership, sale prices diverge from assessed values more (and are not always greater) than for homes in neighborhoods with predominantly white and Hispanic homeownership. This could be a function of the number of sales: if fewer homes sell in these neighborhoods, then the assessment system has little information to incorporate into next year’s assessments. It could also be a sign of gentrification: if home values rise rapidly because of increasing demand, assessment-to-sales ratios can vary widely.
Though this and future analyses, the D.C. Policy Center will continue to monitor housing trends, including residential property assessments, with a racial equity lens.
About the Data
Tax assessment ratios are determined by the District’s Office of Tax and Revenue Real Property Tax Administration. Excluded from this data are any neighborhoods with zero sales in calendar year 2018. Demographic estimates of population demographics in tax assessment neighborhoods are calculated by weighed average of census block contained in each assessment area based on 2018 5-year ACS estimates.