Population density can say a lot about an urban environment, and it’s often used as a signal of how walkable a place is. But common density measures don’t truly capture how easy it is to walk from one location to another.
Transit planners often approximate “walking distance” as half a mile. If pedestrians weren’t constrained by the street grid, this would mean that everywhere within a half-mile radius would be within walking distance. But real cities don’t work that way.
In a city with a regular grid of equally spaced streets, the set of places within a half-mile of any street corner would look like a diamond, as pedestrians could simply walk half a mile along the streets meeting at that corner, but would have to zig-zag to get to locations on other streets.
That’s why, as described in a study recently published by City Observatory, I propose a new measure for assessing density in the built environment. I call it “walkable urban density,” and it more completely captures the number of people within walking distance of a given location.
This metric is useful for analyzing the distribution of residents and jobs in the D.C. area because it allows us to distinguish truly urban places from those where disconnected street grids greatly reduce the potential area where people might choose to walk to transit stations or other destinations. Here, I explain the benefits of measuring walkable density and what it looks like within the Washington region.
Density alone won’t produce an urban environment if you can’t walk to destinations
Population and job density are both important to producing an urban environment where walking and public transit are major forms of transportation. Higher density means that more people will be near any given destination or transit station, making it practical for them to walk there. Higher density is also important because it leads to agglomeration benefits: it’s more efficient to provide services for a larger number of customers, businesses benefit from being near others in their industry, and niche businesses find it easier to attract a critical mass of customers.
Real cities have some big obstacles to walking, however—including rivers, freeways, and superblocks—that can block pedestrians from proceeding further in a given direction. Newer suburban developments are often made up of cul-de-sacs with limited access to arterial roads, forcing pedestrians to go far out of their way. Even if such an area is very dense, the “walkshed” of places that can be reached from any given location may be much smaller than the ideal circle of a half-mile radius.
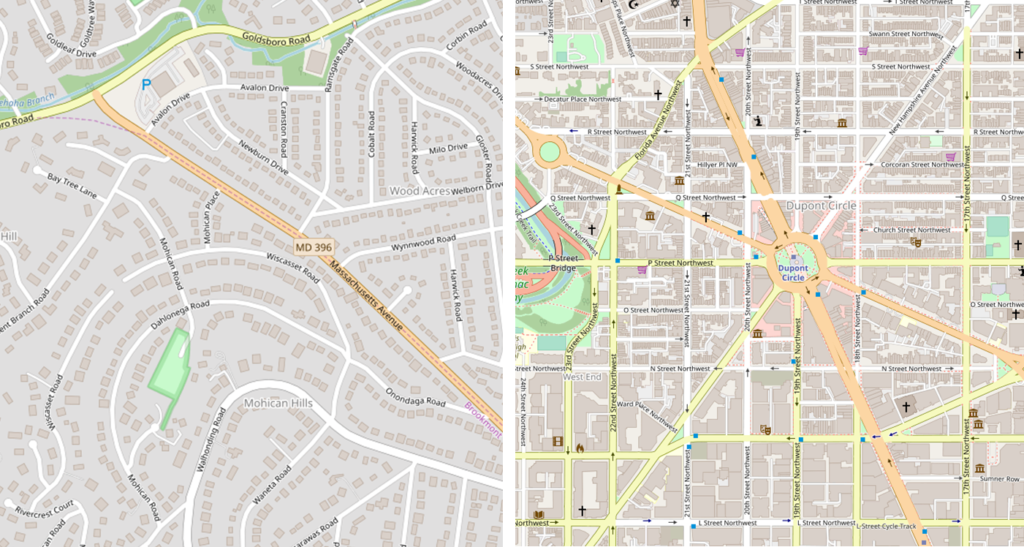
Two views of Massachusetts Avenue
Massachusetts Avenue in Glen Echo is surrounded by curving, indirect side streets with cul-de-sacs, while Massachusetts Avenue near Dupont Circle is surrounded by a regular grid of well-connected streets.

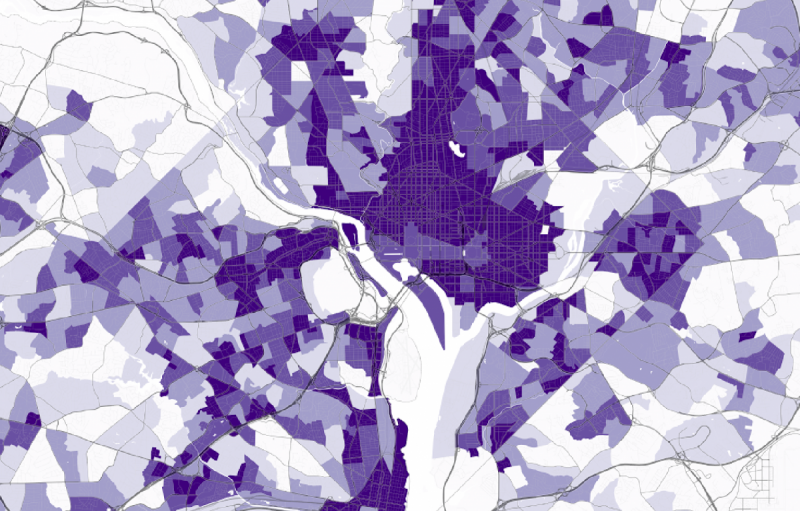
As I discussed in detail in my City Observatory study, I’ve calculated a measure of street grid connectivity called “percent ideal walkshed” for every census block group in the D.C. and Baltimore metro areas. Percent ideal walkshed is the ratio of the area reachable by walking half a mile from the center of a census block group to the area of a circle with a radius of half a mile. Unsurprisingly, the highest values are found in parts of the urban cores with regular street grids, but some suburban areas with well-connected street networks do well, too.
Street grid connectivity in the Washington region
Maps of the D.C. area showing the percentage of an ideal half-mile walkshed that is actually accessible via the street grid for each census block group. The overlaid street map is Stamen Toner Lines. Click here for larger image.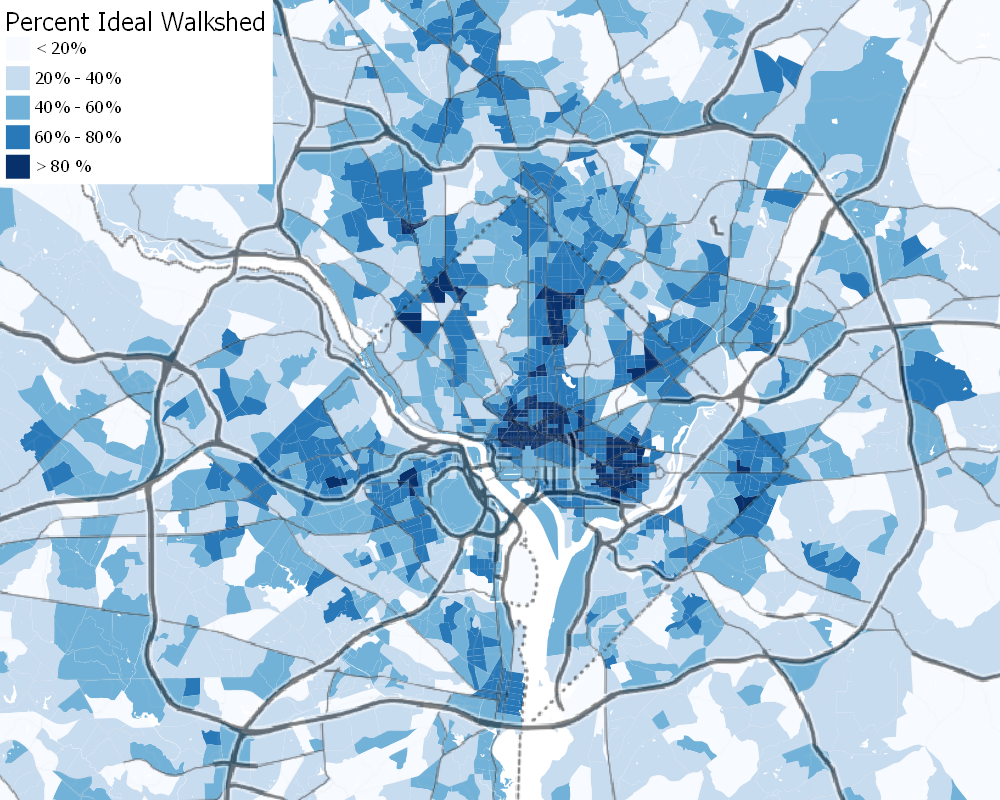

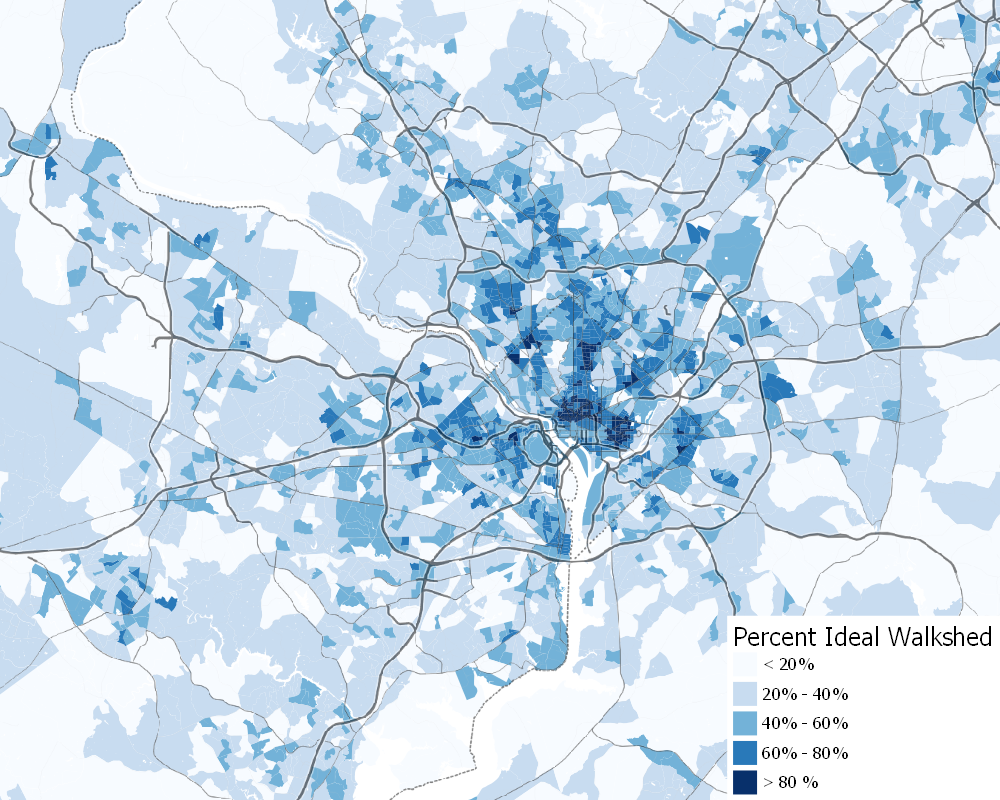

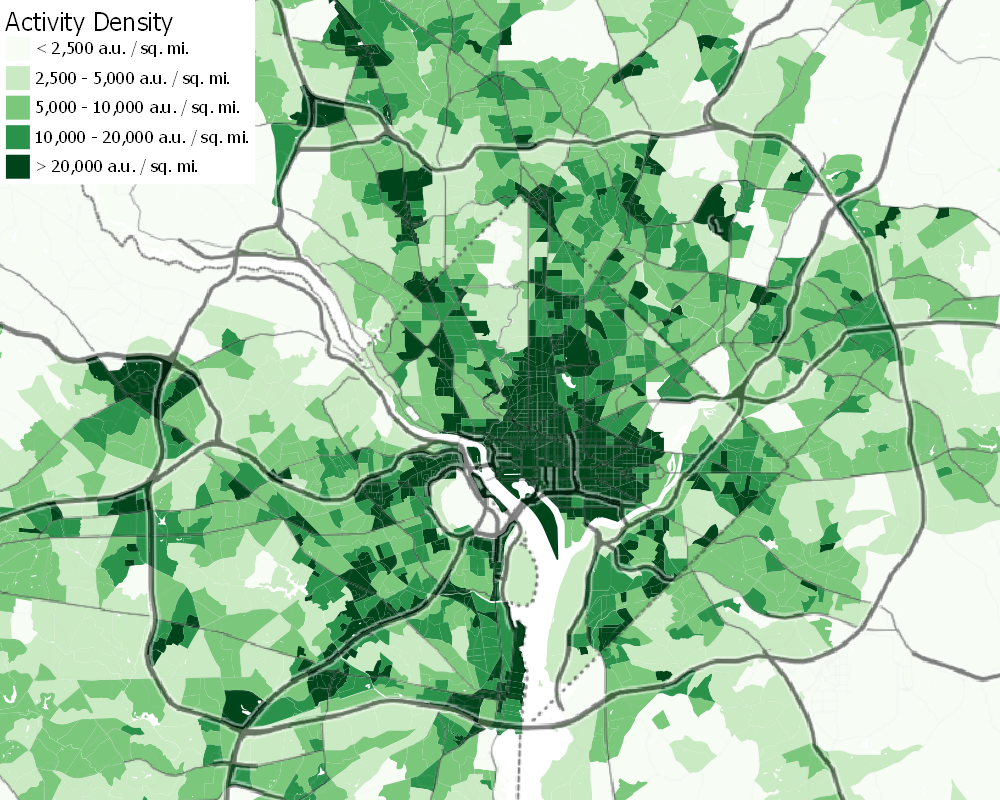
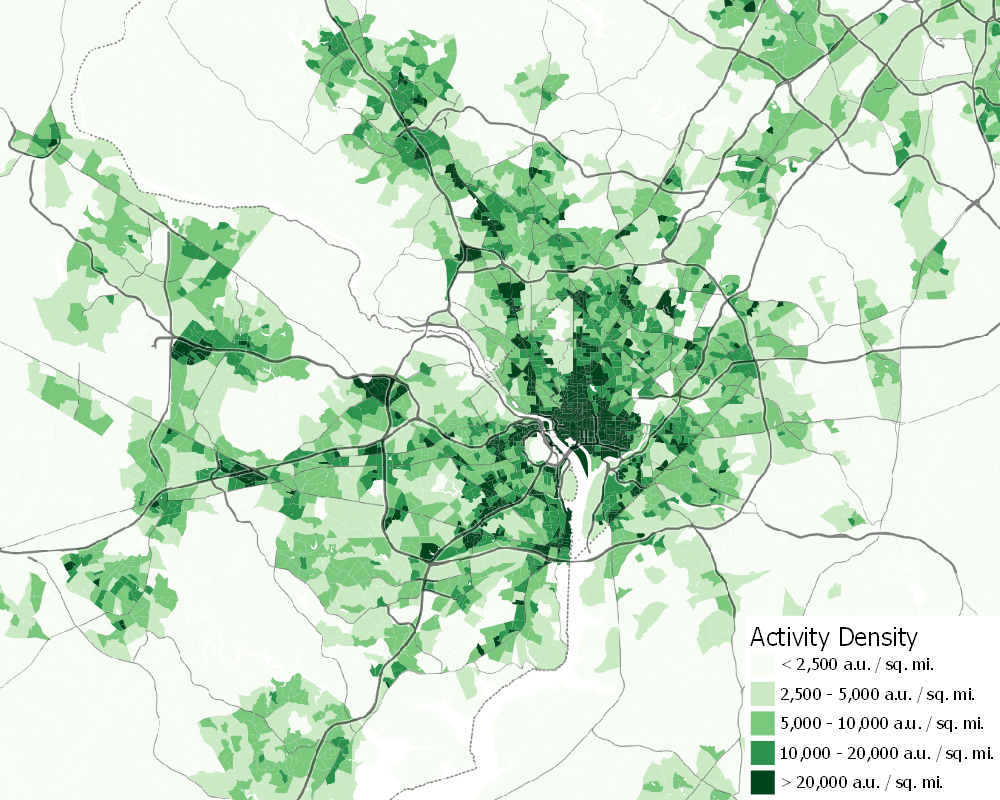
Unsurprisingly, there is significant overlap between the areas with the best-connected street grids and the areas with the highest “activity densities” (the combined density of residents and jobs). However, many of the denser portions of the suburbs still have relatively poorly connected street grids.
Activity density in the Washington region
Maps of the D.C. area showing the density of “activity units” (the sum of residents and jobs) by census block group. The overlaid street map is Stamen Toner Lines. Click here for larger image
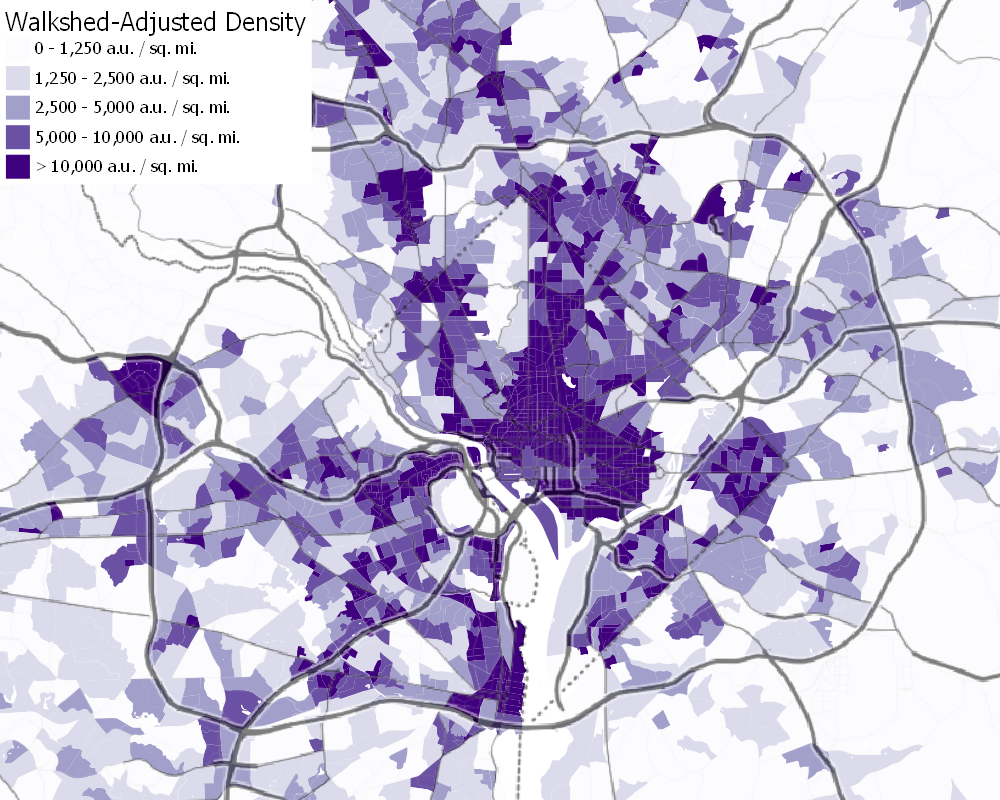
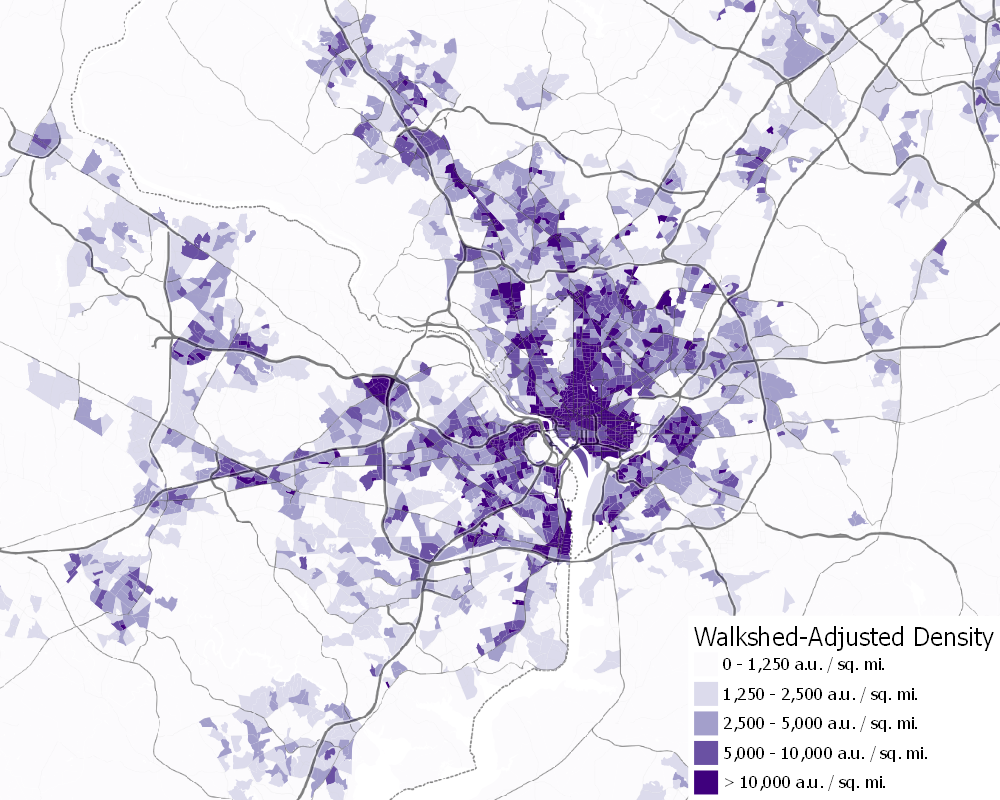
As a result, a map of “walkshed-adjusted activity density,” calculated by multiplying activity density by percent ideal walkshed, shows more centralization of dense areas closer to the urban core. These areas, with both high density and well-connected walksheds, are the areas with the highest walkable density.
Walkable density in the Washington region
Maps of the D.C. area showing walkshed-adjusted density: activity density multiplied by percent ideal walkshed for each census block group. The overlaid street map is Stamen Toner Lines. Click here for larger image.


Images by the author.
The District is surrounded by dense suburbs that lack connected street grids
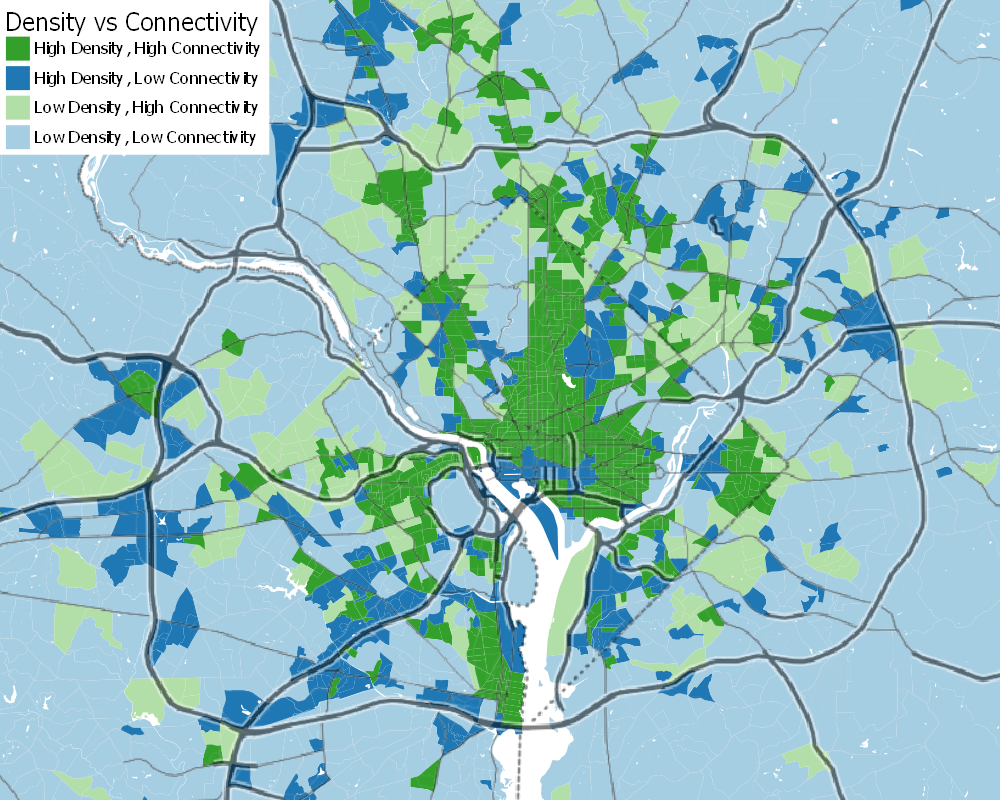
Just outside the District’s borders, there are several close-in areas, most of them former streetcar suburbs, that have a combination of high density and reasonably well-connected street grids: downtown Silver Spring and Bethesda in Montgomery County, Langley Park in Prince George’s County, the Rosslyn-Ballston corridor and Crystal City-Aurora Highlands in Arlington, and the Old Town and Del Ray neighborhoods of Alexandria.
There are also several clusters of significant areas with good connectivity but lower densities: the Connecticut Avenue corridor in Chevy Chase and the Rhode Island Avenue/Baltimore Avenue corridor in Mount Rainier, Brentwood, and Hyattsville. These would be ideal areas to increase density in the suburbs, something that is slowly happening with redevelopment along Rhode Island Avenue, but which is unlikely to happen in Chevy Chase given the area’s history of opposition to even relatively minor changes.
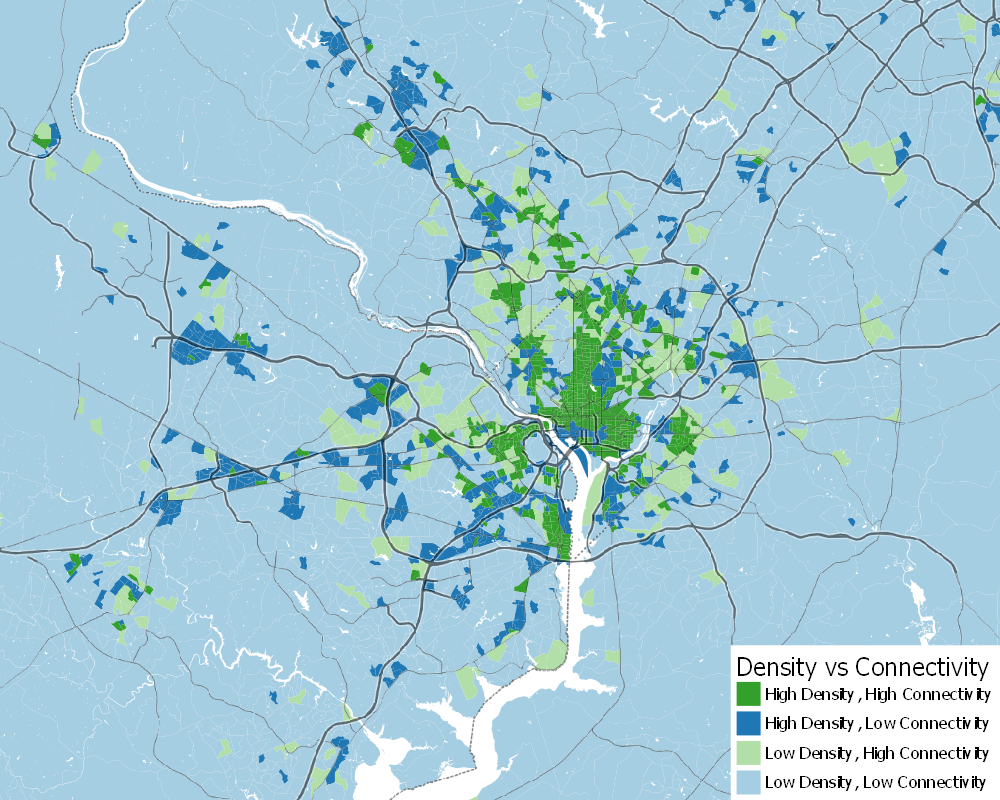
Most of the newer development in the DC suburbs has occurred further out, though, mostly in areas that—even when they are dense—do not have connected, human-scale street grids. Examples of this include the I-395 corridor, Annandale, Dunn Loring-Merrifield, Tysons, Fair Oaks, Centreville, and the Reston-Herndon Corridor in Virginia and the I-270 Corridor and the US-50/Beltway interchange in Maryland. Even the new transit-oriented developments near the White Oak and New Carrollton Metro stations have significant connectivity issues, although the street grids in these areas will hopefully improve as redevelopment continues.
While efforts are being made to make the core of Tysons more walkable and Reston Town Center has a street grid, these are islands in seas of much less well connected density, a problem which will make it harder for them to reduce car dependence, even with their new Silver Line stations. Retrofitting high-density suburban clusters for more walkability is essential to increasing transit ridership and reducing vehicle miles travelled on a regional level, given the large fraction of jobs and residents located them. That said, it is a tricky problem, as it both requires breaking up superblocks and connecting the street grid and improving streetscapes to make them more pedestrian friendly.
The low-density parts of the region with good street connectivity and—in many cases—more pedestrian-friendly streetscapes are, in theory, good targets for densification, especially since they are generally located closer to the urban core and existing transit than outside-the-Beltway suburban clusters of density. However, this requires changes to zoning and the elimination or modification of the single-family, residential-only zoning that restricts housing supply.
Density vs. connectivity
Maps of the D.C. area dividing census block groups into four categories based on whether they have an activity density above or below 10,000 activity units per square mile (often cited as the density where car-dependence breaks down) and a percent ideal walkshed above or below 50%. The overlaid street map is Stamen Toner Lines. Click here for larger image


Images by the author.
Even inside the District, there are dense areas that suffer from poor connectivity
Poorly connected cul-de-sacs and grids of arterials that are spaced too far apart for pedestrians are a common problem for American suburbs built after World War II. However, the District itself also has significant areas with poor street connectivity, some of which are quite dense.
First of all, there are three areas where poor connectivity is unavoidable because of geography, but also not particularly concerning. The deep gorge of Rock Creek is expensive to bridge, and is only crossed in a relatively few places. Although this does constrain the options for bus routes across the park, Rock Creek Park is a beautiful natural area that doesn’t need a dense, urban street grid.
Likewise, there are relatively few bridges across the Anacostia, which contributes to longer commute times for workers living east of the river. However, much of the area along the river, particularly in Northeast, consists of parkland or similar uses, such as the National Arboretum. The bank of the Potomac upstream from Georgetown is also parkland—the C&O Canal—but the gorge of the Potomac, like that of Rock Creek, is steep enough to prevent a normal street grid in this area, anyway.
A bigger problem are the areas of the District where large institutional campuses and freeways and freeway-like roads break up the street grid. A prime example of this is the dense residential neighborhoods along the Anacostia Freeway in Northeast: the freeway poses a significant barrier to pedestrians, even at the relatively few places where it can be crossed on pedestrian overpasses or by walking along major roads.
A similar issue is caused by the grade-separated portion of North Capitol Street north of the McMillan Reservoir. The combination of road design and the presence of a number of large campuses—the Old Soldiers’ Home, the Washington Hospital Center, several cemeteries, and several college campuses—that allow no or limited pedestrian through-traffic produce an area that, although it is dense, is very poorly connected and difficult to navigate on foot.
Likewise, while steep hills and stream valleys do contribute to the poor connectivity of much of the southern portion of the District east of the Anacostia, the existence of freeways—Suitland Parkway and I-295—and large, closed-off institutions—Joint Base Anacostia-Bolling, the Coast Guard headquarters, and the St. Elizabeth’s campus—combine to produce a very disconnected area that is hard to serve effectively with transit.
About the data
Walksheds were calculated with the “service area” tool in QGIS 3; all other data processing was done in R, primarily using the sf package for data analysis and the tigris, tidycensus, and lehdr packages to download data. All calculations were done using the Maryland state plane (EPSG:6487) as calculations in a US-wide planar projection caused too much distortion to get accurate and consistent area values.
Walksheds were calculated from the point on the street network nearest to the centroid of the land portion of each block group. All walksheds were based on a travel distance of 800 m and a 10-m tolerance for geometry gaps. Although this is narrower than the width of many roadways, it was found that using a larger tolerance caused issues in certain areas—particularly in Portland, OR—where block sizes were very small and a larger tolerance could cause the QGIS service area tool to randomly jump across blocks. An 80-m buffer around the walkshed line features was used to calculate the area of the walkshed.
My walksheds were calculated using US Census 2018 Tiger-Line street networks with roads marked as freeways and freeway ramps removed. Unfortunately, this data does not include information on the presence or absence of sidewalks.
Population and job data were also taken from US Census products: the 2018 5-year American Community Survey estimates for population and the 2015 Longitudinal Employment-Household Dynamics data for jobs. This jobs data includes private, state government, and Federal employees, but excludes active-duty military personnel and some civilian Federal employees in defense and national security jobs.
Feature image by the author. This article also appeared at Greater Greater Washington.
DW Rowlands is a human geography grad student and Prince George’s County native, currently living in College Park. More of their writing on transportation-related and other topics can be found on their website. They also write for Greater Greater Washington, where they are on the Elections Committee. In their spare time, they volunteer for Prince George’s Advocates for Community-Based Transit. However, the views expressed here are their own.
