
Out-of-school time (OST) programs, such as afterschool and summer programs, are important to many families the District of Columbia. To determine what kind of out-of-school time (OST) programming and how many OST seats the city needs to invest in, the city must first determine policy goals and what populations need these services. Using the universe of children and youth attending D.C. public schools as the base (including both DCPS and public charter schools), this section identifies the potential need for subsidized out-of-school time programs based on the distribution of children and youth across two broad age groups and four broad policy targets, and identifies what gaps exist under each metric.
About this series
This publication is part of a series adapted from our full report commissioned by the District of Columbia Deputy Mayor for Education (DME), Needs assessment of out-of-school time programs in the District of Columbia.
Other publications in this series include:
- Chart of the week: D.C. children face unequal access to out-of-school time programs
- Demand for out-of-school time programming shifts, depending on where students live versus where they go to school
- How many out-of-school time seats D.C. has, and where they’re located
- How close are out-of-school time programs to where students live?
- Who provides of out-of-school time programs in the District of Columbia?
- Out-of-school time programs in the District of Columbia: Parent and guardian experiences
- Recommendations for out-of-school time programs in the District of Columbia
Access the underlying original report in printable PDF format here.
To determine what kind of out of school time (OST) programming and how many OST seats the city needs to invest in, the city must first determine policy goals and what populations need these services. Using the universe of children and youth attending D.C. public schools as the base (including both DCPS and public charter schools), this section identifies the potential need for subsidized out-of-school time programs based on the distribution of children and youth across two broad age groups and four broad policy targets. It then develops four need metrics and estimates of gap between the number of children and youth compared to the number of available seats for each metric.
Defining metrics for OST need
One way to define the optimal capacity of OST programs might be to look at surveys of families
and young people that ask about participation preferences. For example, Afterschool Alliance surveys suggest that 50 percent of D.C. children and youth who do not participate in afterschool programs say they would attend such programs if they had access to them.1 This data point would imply that as many as 42,500 public school students may be underserved by afterschool programs.2 On the other hand, the two surveys implemented by PAVE in support of this report suggest that approximately 25 percent of families with students attending PK3 through grade 8, and 13 percent of parents with students attending grades 9 through 12, say they would attend such programs if they had access to them. Using this as a definition of need, an estimated 28,000 children attending D.C. public elementary and secondary schools, and 1,900 youth attending public high schools, are not being served.
While these are useful data points, this approach may not capture family preferences or program quality. And from a policy standpoint, it does not connect needs to specific policy goals that the District has for subsidized OST programs (for example, youth engagement and safety, violence reduction, personal growth, etc.). It also does not address the sort of barriers that might prevent a family from participating in OST programs even if programs were available.
These limitations shaped the needs metrics that were developed in the 2017 landscape analysis of the OST programs developed by the D.C. Policy Center and the same limitations still apply today. For gap analyses, the D.C. Policy Center has replicated the need metrics developed for the 2017 report. As such, the report defines four potential metrics of need for OST programs, based on different policy goals:
- The universal coverage metric would provide sufficient subsidized OST capacity for every child or young person who attends a public school in D.C.;3
- Broad income-based targeting,4 i.e. targeting low-income children and youth close to or under 300 percent of federal poverty line (FPL), using Children’s Health Insurance Program (CHIP) eligibility as a proxy;5
- Targeting based on “at-risk” status; and
- Narrow income targeting, focused on children and youth living in households under the FPL.6 These four metrics are meant to serve as a starting point for understanding the scope of need and capacity in the District’s OST programs.
These metrics demonstrate how many children and youth D.C.’s subsidized afterschool and summer programs would serve if all children and youth in these categories (and only children and youth in these categories) enrolled in and attended them—conditions that would not be met in practice.7
Universal coverage
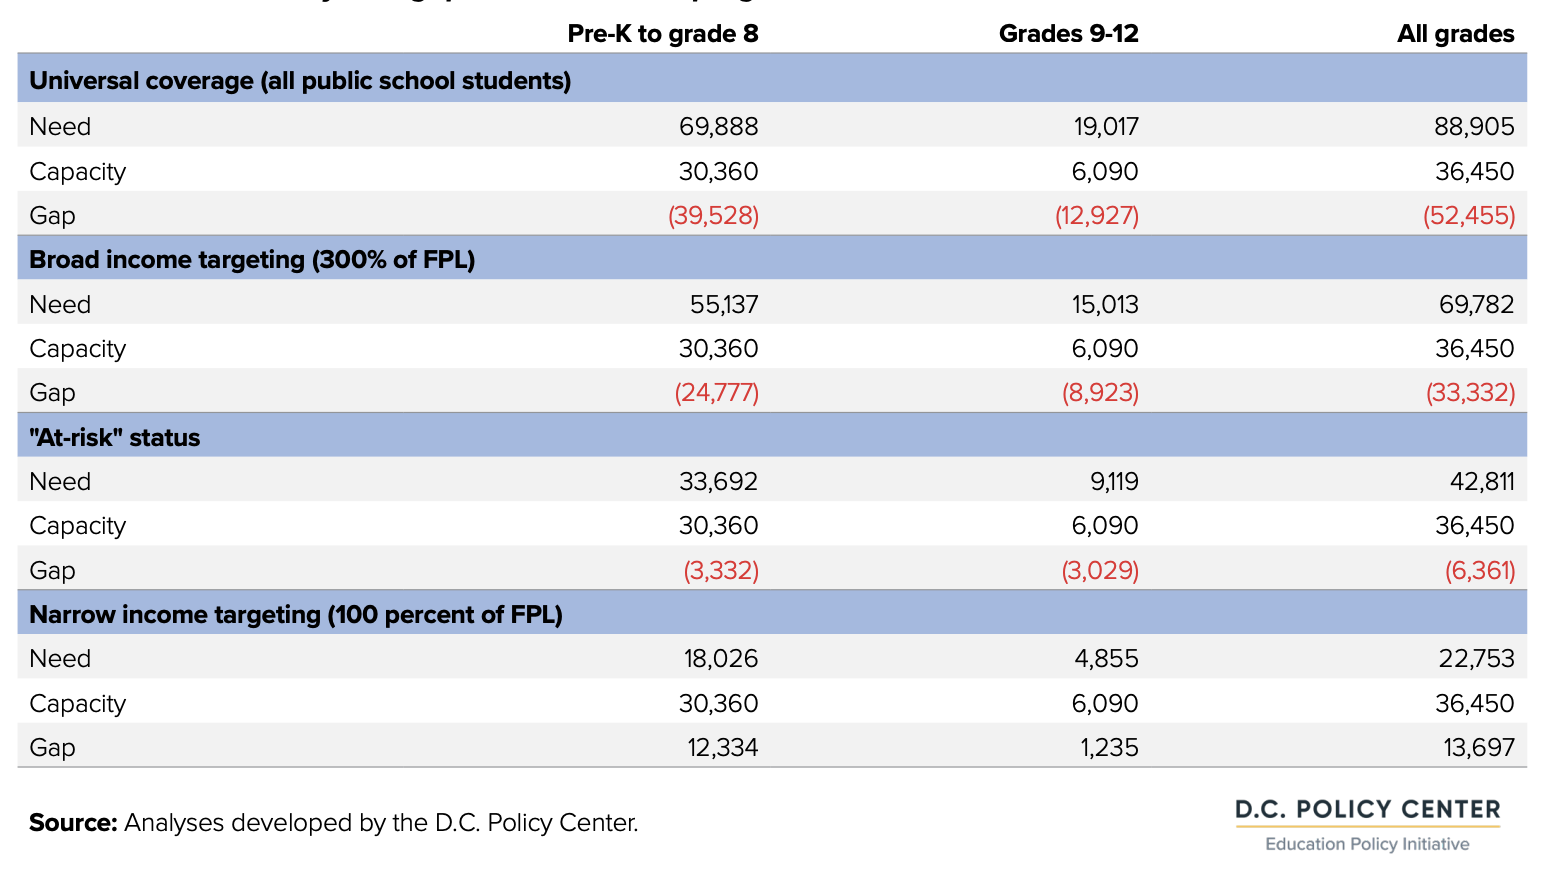
The broadest metric, universal coverage, assumes that the policy goal is to be able to provide OST programming for all 69,88 children enrolled in public schools at grade levels PK3 to 8, and all 19,017 youth enrolled in grades 9 to 12.8
Distribution of need by ward under four policy targets
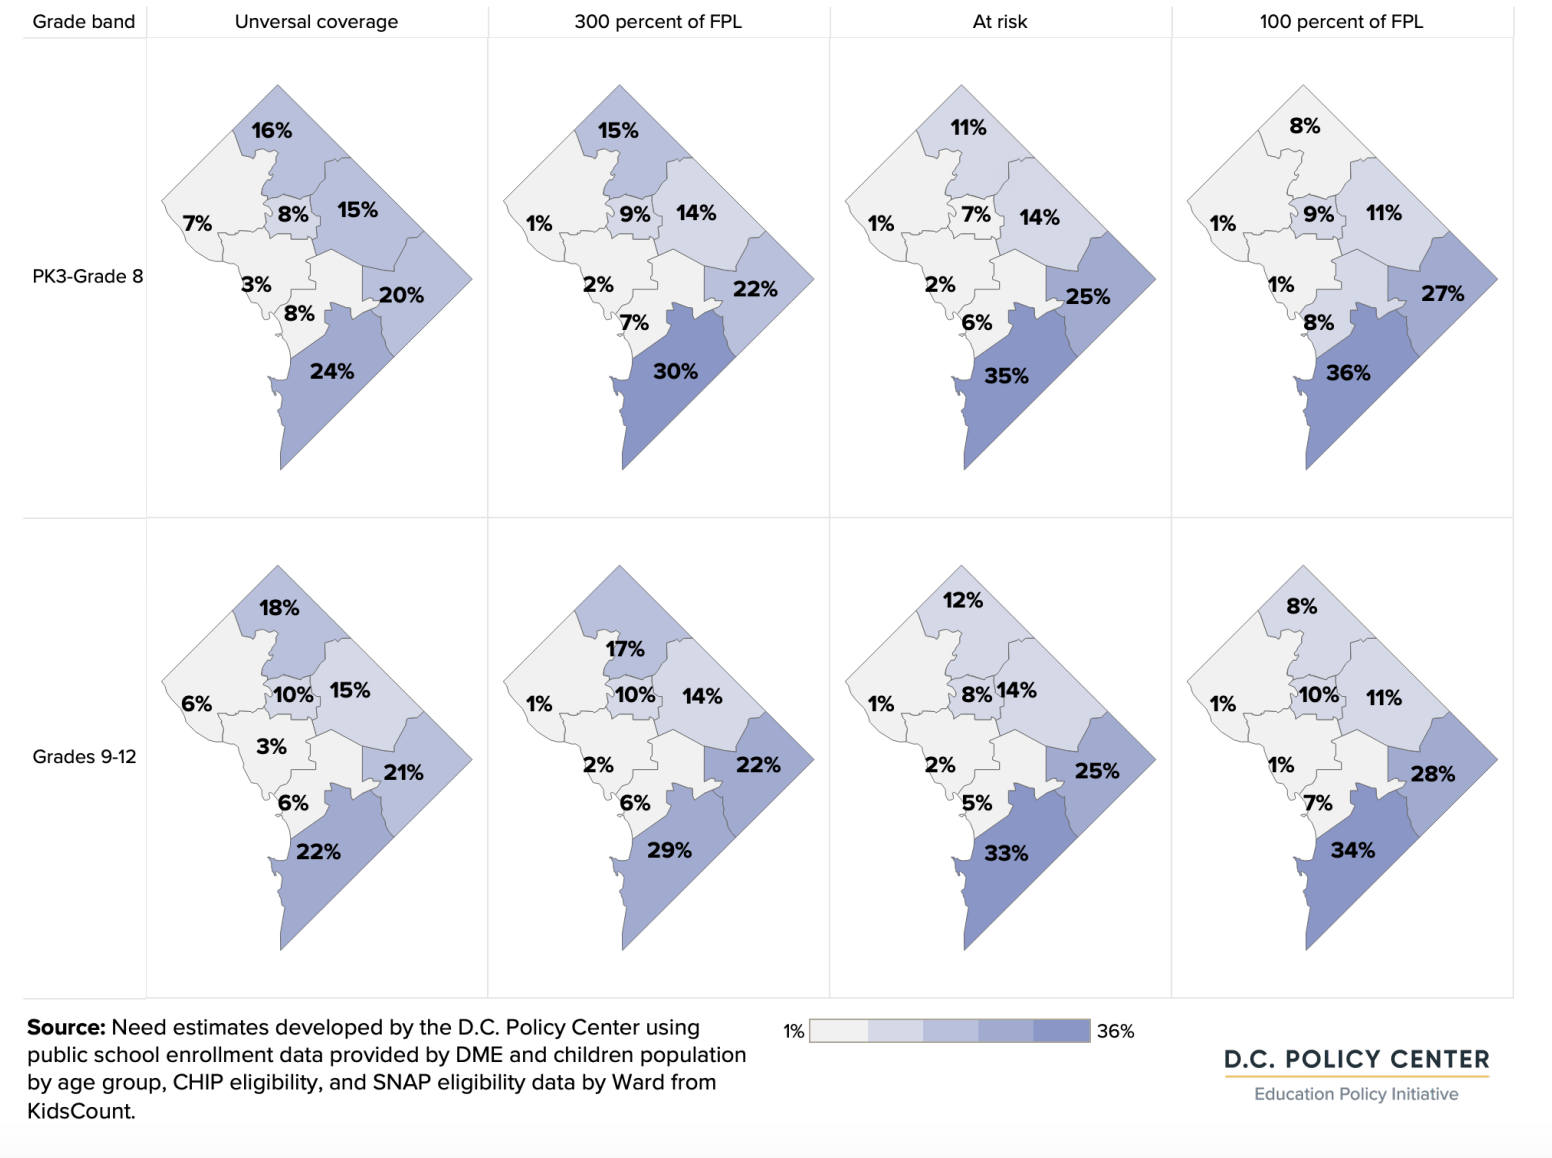
Universal coverage, by definition, would require subsidized OST capacity to mirror the distribution of children and youth according to the location of the public school in which they are enrolled.9 If all children and youth attended subsidized afterschool and summer programs in the same ward as their schools, program capacity would be proportionately lowest in Wards 1, 2, and 6, particularly for children in PK3 through grade 8.
Broad income targeting
If the District used the metric of providing subsidized OST program capacity equivalent to the number of children and youth living in households whose earnings fall below 300 percent FPL, then target populations would be 54,855 for children in PK3 through grade 8 and 14,957 for grades 9-12.
If all children and youth in households at this income threshold (and only children and youth meeting this income threshold) attended subsidized afterschool and summer programs, about half of this capacity would be in Wards 7 and 8. This pattern is most prevalent for children in PK3 through grade 8.
Targeting “at risk” children and youth
Focusing on children and youth who meet the criteria for being academically “at risk”—thus limiting the subsidized out-of-school time programs to children and youth who meet specific measures of economic and academic challenges—would translate to 26,863 for children in PK3 through grade 8 and 7,310 youth for grades 9-12.10 Similar to the distribution of students under the at-risk metric, a third of the program capacity would be concentrated in Ward 8, and a quarter in Ward 7.
Narrow income targeting
Finally, using the metric of supplying enough capacity in subsidized OST programs only for children and youth who are living in households below FPL suggests the need for subsidized spots would decline to 17,886 for children in PK3 to grade 8 and 4,867 for youth in grades 9 through 12. For both age groups, this metric—the narrowest policy goal the report considers—would provide capacity for only about a quarter of children and youth compared with those served under universal coverage.
In terms of geographical distribution, 22 percent of capacity for children in PK3 through grade 8 would be in Ward 7 under this metric, and 35 percent in Ward 8. For programs serving youth in grades 9-12, 17 percent of capacity would be in Ward 1, 22 would be in Ward 7 and 29 percent would be in Ward 8 under this metric.
Potential gaps
As the review of the characteristics of District’s children and youth in Chapter Two has revealed, there are deep socioeconomic disparities across age groups, neighborhoods, and school types and locations, especially when measured by student’s residence location. Discussions around out-of-school time policies—including what to offer, where to offer programs, and how to pay for them—cannot ignore these disparities, and way to address these disparities should be considered in OST policy goals.
As outlined in Chapter Four, this analysis considers four potential metrics for coverage that vary from universal coverage (providing enough subsidized OST capacity to enroll all children and youth enrolled in public schools in D.C.) to more targeted populations based in household income or “at risk” status.11 This gap analysis brings together the number of seats needed (using information about potential need based on various policy targets, as outlined in Chapter Four) with the estimated capacity developed in Chapter Three. The result of the analysis is an estimate of the gap between capacity and need under each policy goal.
City level gaps
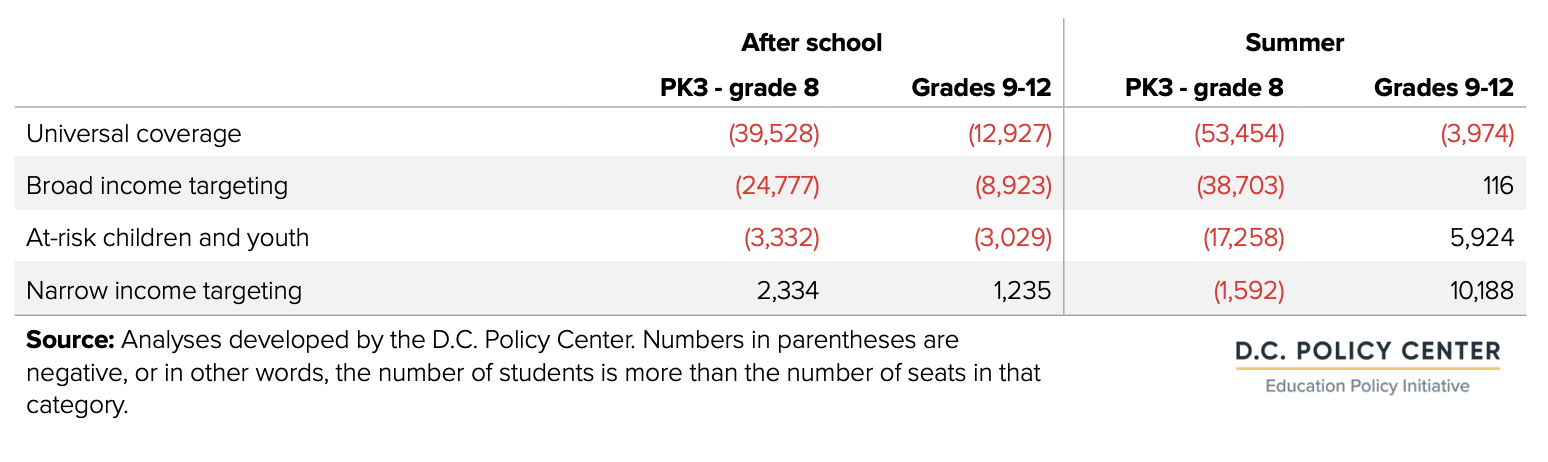
Comparison of available seats to the four metrics show that for afterschool programs, the city faces seat shortfalls in all four metrics except 100 percent of FPL at the PK3 through grade 8 level, and in all four metrics except for 100 percent of FPL for high school level. For summer programming, existing capacity is not sufficient to provide full coverage under any of the four need metrics at the PK3 through Grade 8 level. In contrast, the only metric under which summer programs are not sufficient under the high school level is universal coverage. As noted, before, existing seat capacity at the high school level is 80 percent of all students, but more than half of these slots are those offered under MBSYEP.
City-wide gap estimates under four metrics of need
Comparing these findings to findings from the 2017 study highlights an important trend. The number of OST seats has grown faster than the number of public school students, reducing gaps under the universal coverage metric, especially for the PK3 through grade 8 grade band for afterschool programs, and all grade bands for summer programs. Consequently, gaps have narrowed for at-risk students as well as students from households under 100 percent of FPL.
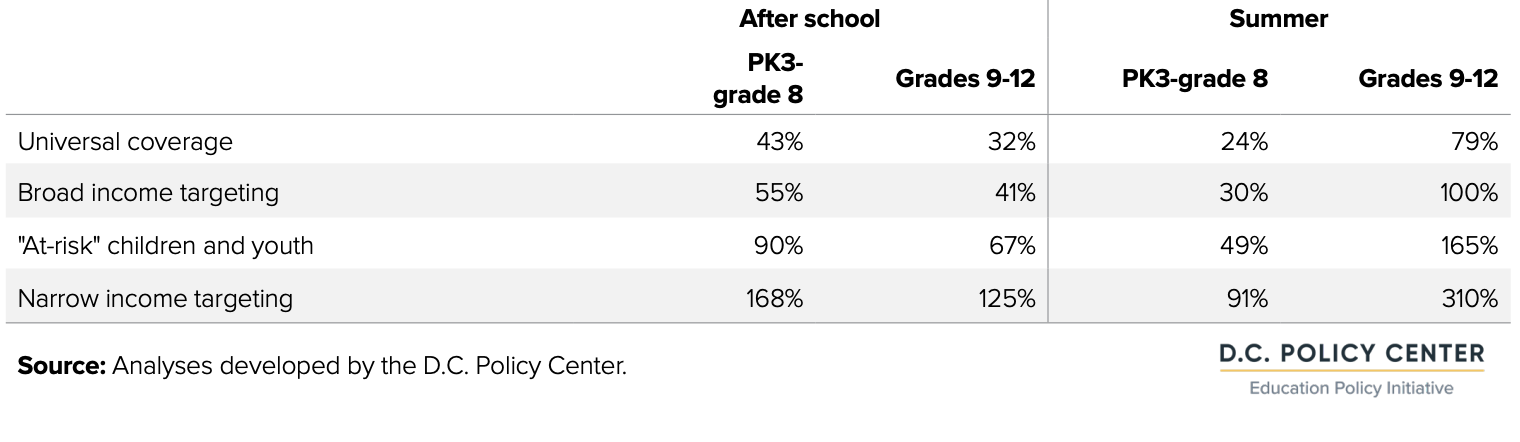
The same information presented as coverage ratios shows what programs have the deepest needs relative to the existing supply. This information shows that afterschool coverage is strongest for grades PK3 through 8 compared to high school programs. In contrast, summer OST programs that serve high school students offer a much more robust coverage compared to OST programs serving younger students during the summer. High school summer coverage, as noted, is mainly driven by the MBSYEP. But even excluding the MBSYEP seats (55 percent of all summer seats), summer programs that serve high school students still typically offer better coverage than for the PK3 to grade 8 grade band.
City-wide coverage ratios under the four metrics of need
Estimated gaps for afterschool programs
For children in the younger age group (PK3 through grade 8), the estimated gap between capacity and need for subsidized afterschool programs is 39,528 seats under the broadest program target of universal coverage. For narrower targets, the estimated gaps for younger children living in households at 300 percent of the poverty line is around 24,777; for those meeting criteria for “at risk” status, the gap is less than 3,332. Under these hypothetical conditions, there are no estimated gaps in overall capacity to meet the equivalent needs of all children in PK3 through grade 8 living in households below FPL for afterschool programs.
At the high school level, the District would need 12,927 seats to fill the gap between need and capacity to provide subsidized afterschool programs to all youth in grades 9-12 enrolled in public schools. Gaps still exist under the broad income targeting and targeting students with “at risk” status (8,929 seats, and 1,283 seats respectively), but there are sufficient subsidized afterschool slots for the number of students at or below the poverty line.
Estimated citywide gaps for afterschool programs
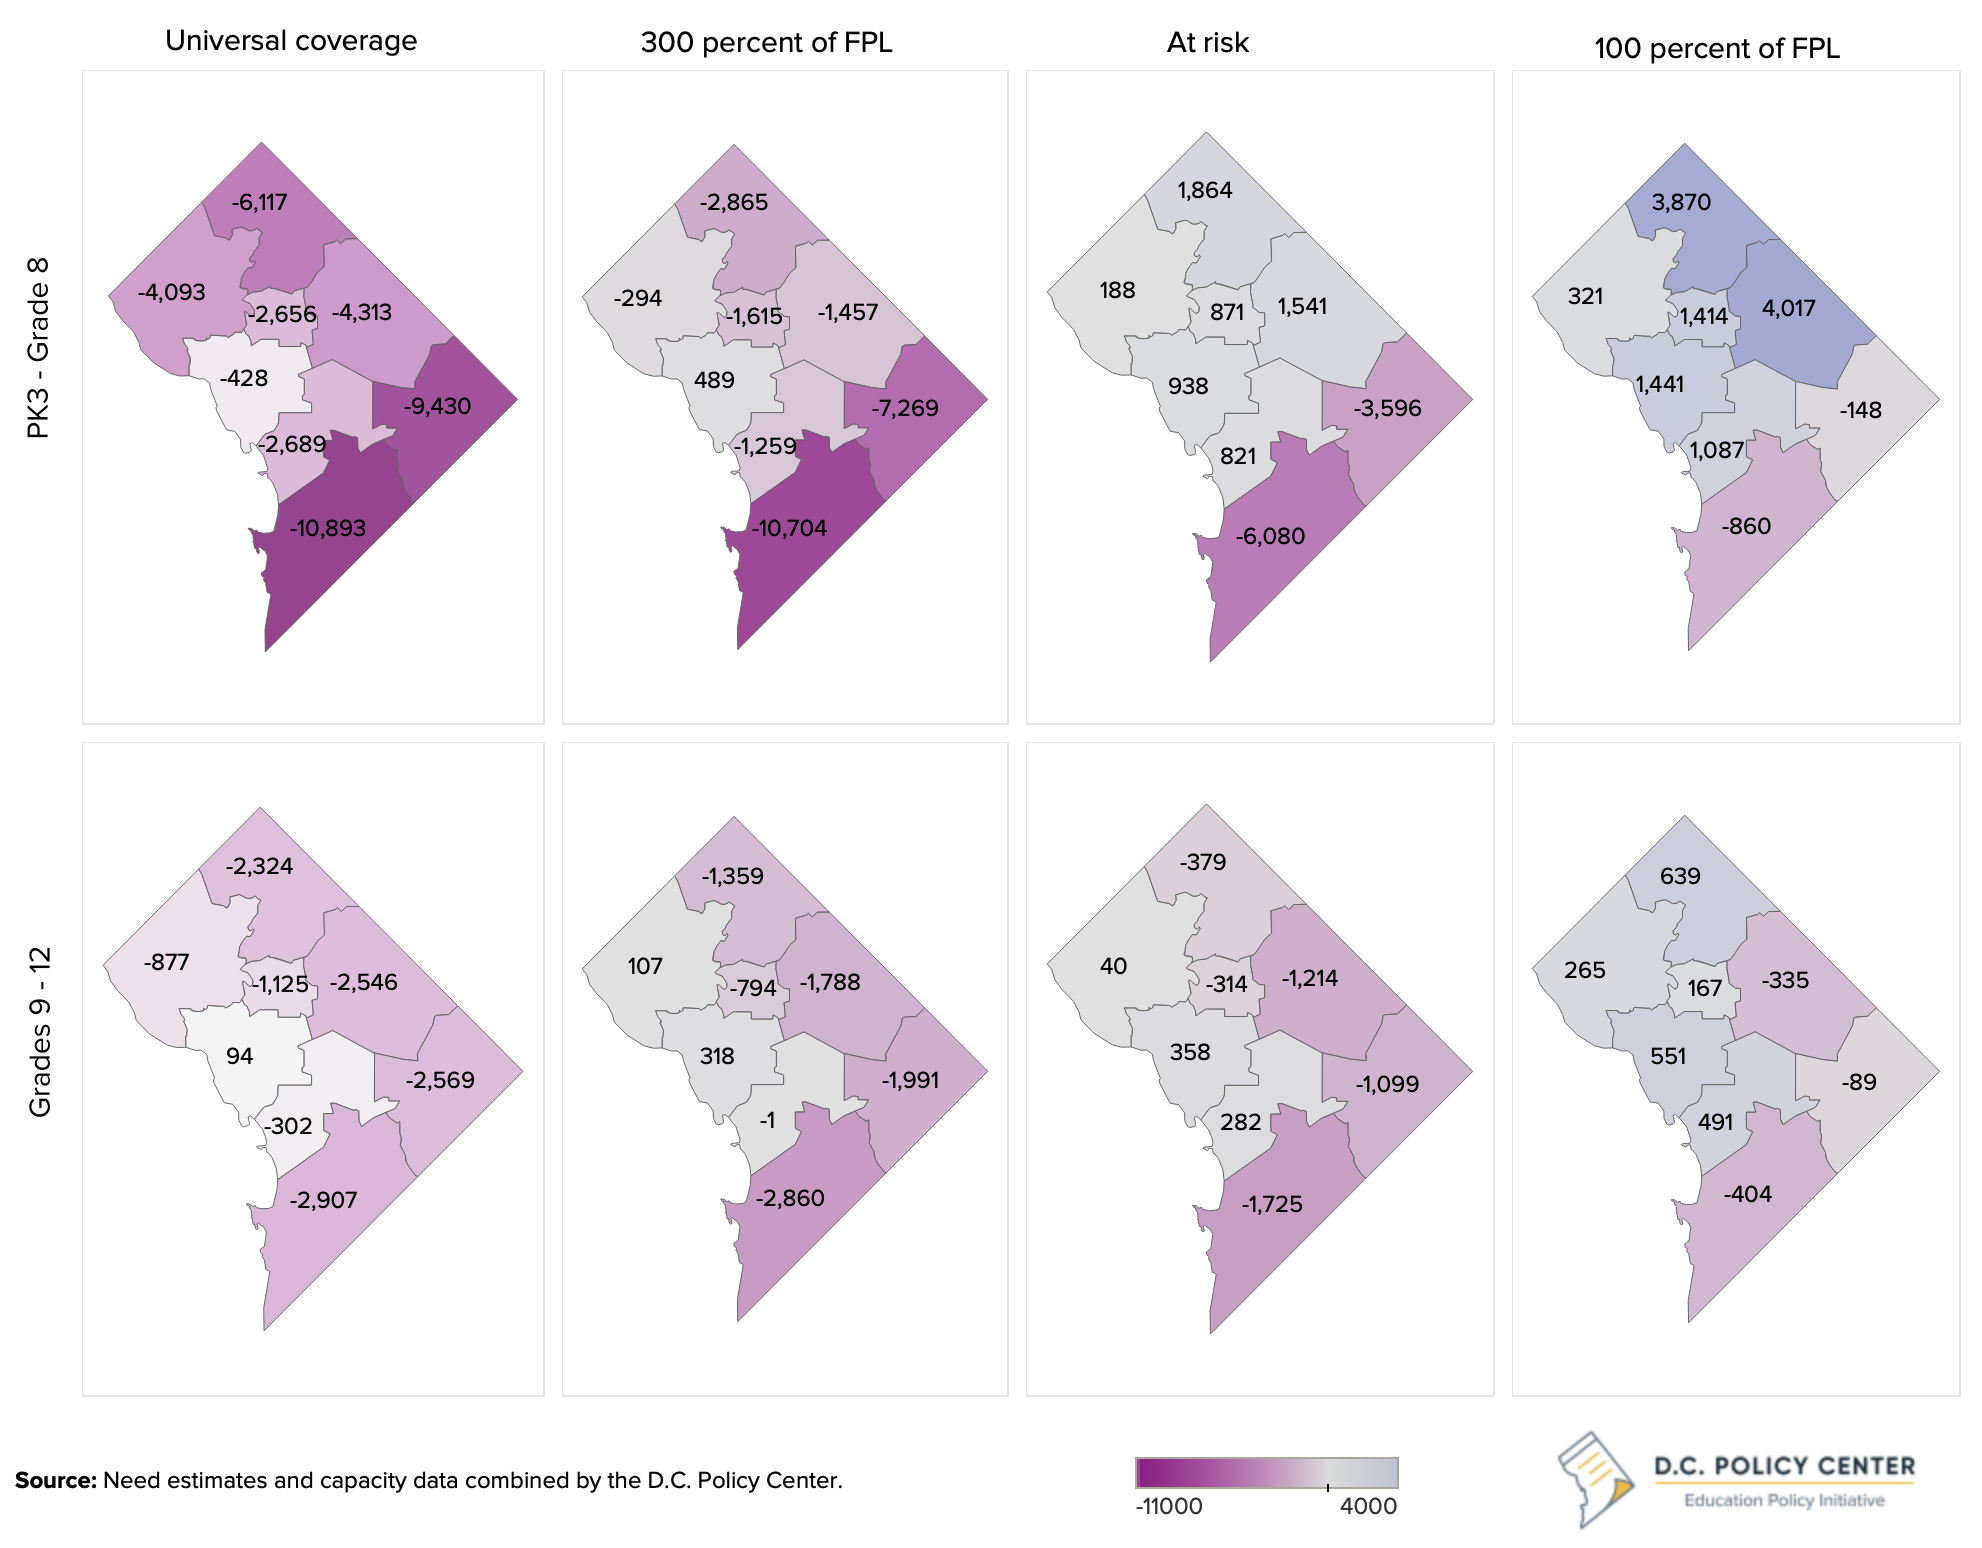
At the ward level, for students attending PK3 through grade 8, the greatest gaps (measured based on students’ residency) are in Wards 7 and 8, followed by Wards 5, 4, and 6. The gap closes for Wards 3, 2, and 1 at broad income targeting of 300 percent of FPL, and closes for all wards except Wards 8 and 6 under the narrow income targeting of children and youth under 100 percent of FPL. At the high school level, the largest gaps are for Wards 8 and 4, and these gaps remain in place, though at manageable numbers under narrow income targeting.
Importantly, the map below bases needs assessments on student residence, which may not be the most convenient for families, particularly for afterschool programming. Whether OST programming should be provided near student’s homes versus near their schools is a policy decision that should be based on demand from families as well as barriers to participation, such as ability of parents to pick students up and transportation options.
Afterschool gaps by ward, based on student residence
Summer programs
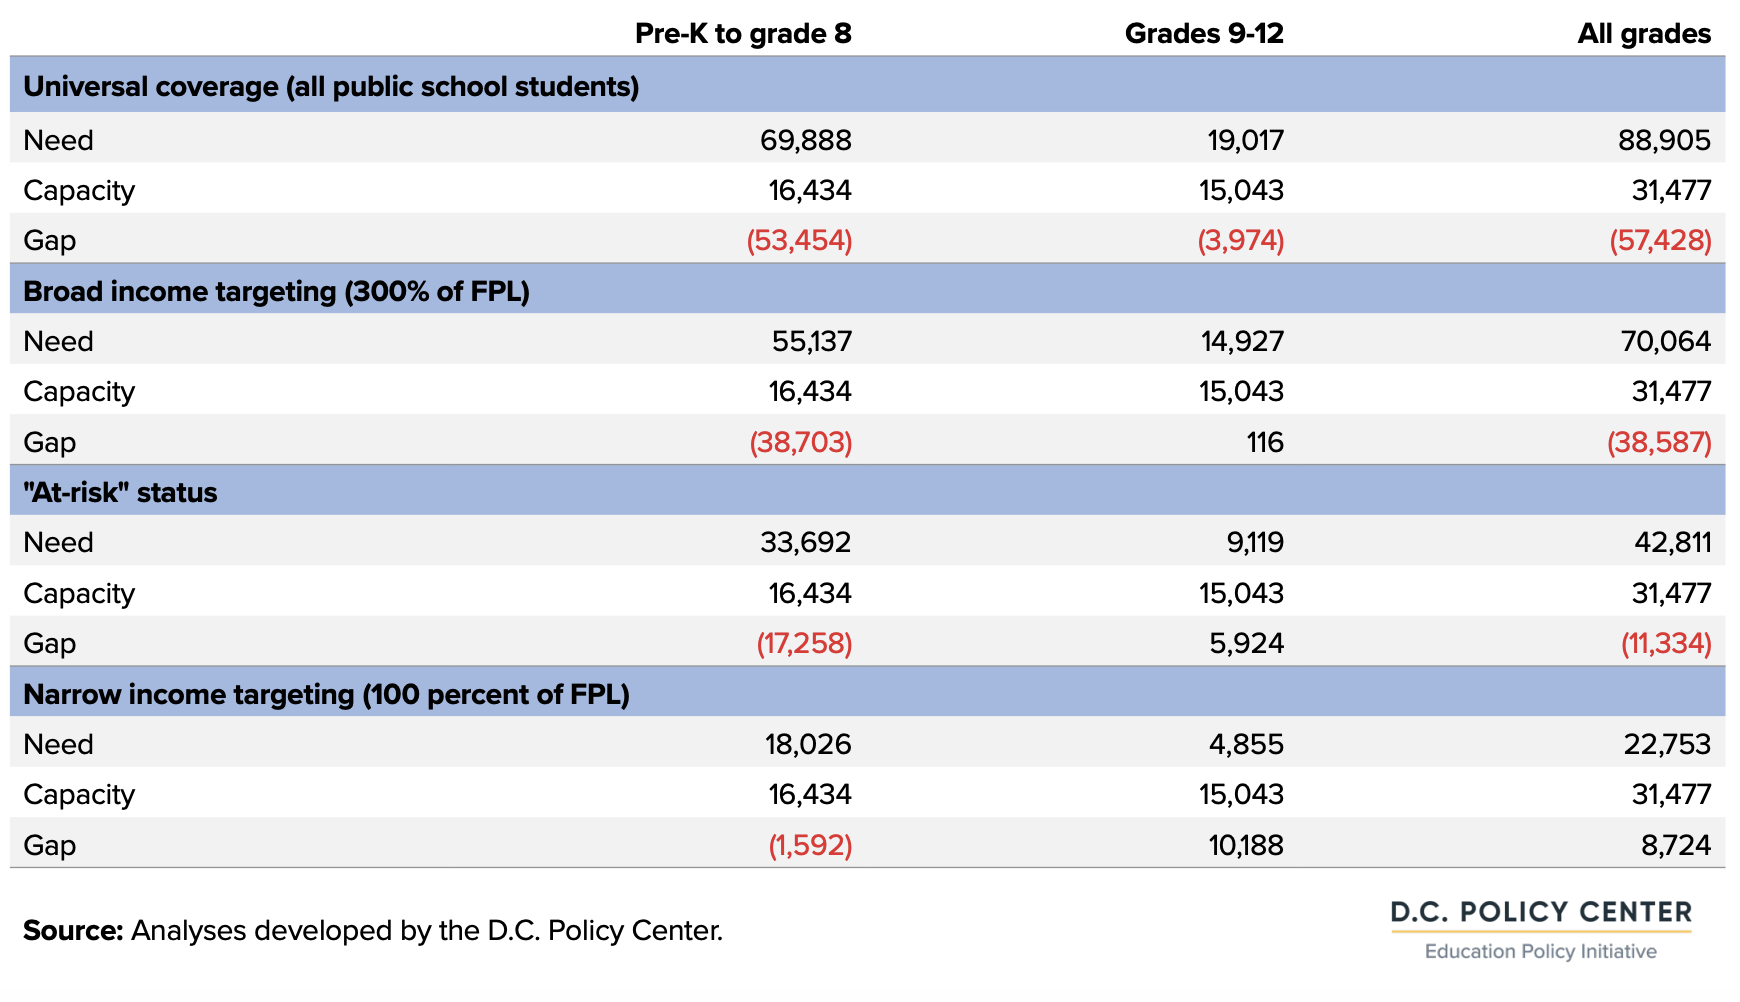
For children in the younger age group (PK3 through grade 8), the estimated gap between capacity and need for subsidized summer programs would be 53,454 under the broadest program target of universal coverage. The gaps decline as the need target becomes narrower but remain at all four targets evaluated in this report.
At the high school level, the District faces an estimated gap of 3,974 seats between need and capacity if its goal were to provide subsidized summer programs to all youth in grades 9-12 enrolled in public schools. Under this analysis, there are no overall gaps in estimated capacity for subsidized summer programming under the other three more narrowly targeted metrics for grades 9-12, although it is worth noting that most summer program capacity for high school-aged youth is the Mayor Marion S. Barry Summer Youth Employment Program.
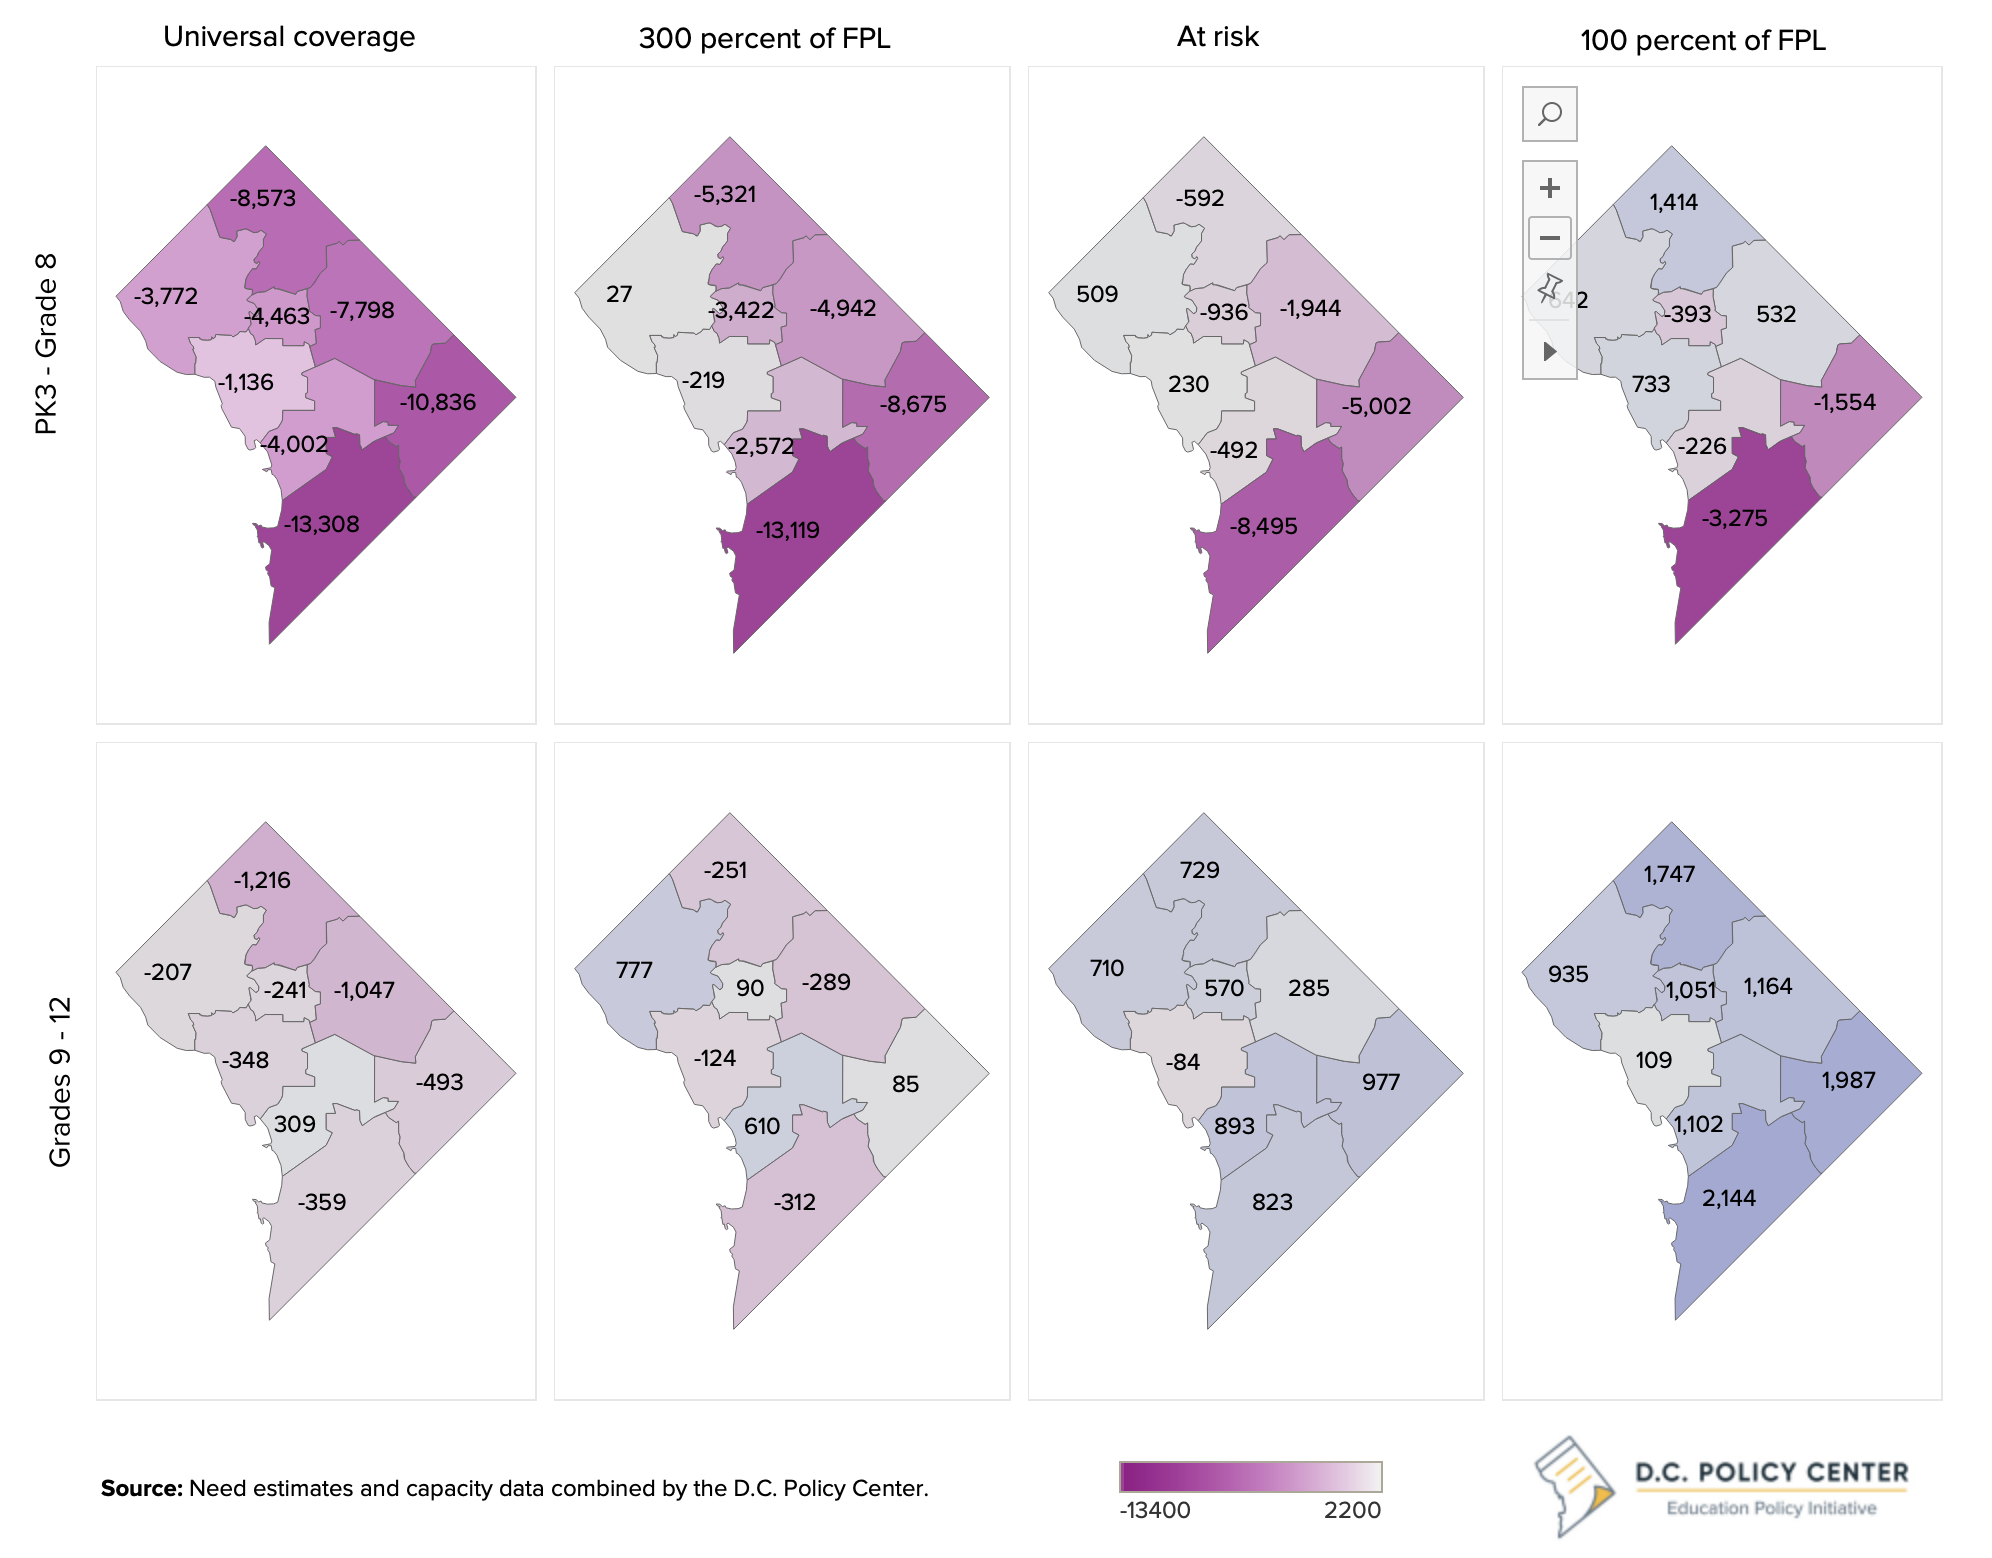
At the ward level, there are significant gaps in seat availability for children enrolled in PK3 through grade 8 under all targets, except for the narrow target of 100 percent of FPL. For older youth enrolled in high schools, the gaps are much smaller, mostly because of the MBSYEP.
Estimated citywide gaps for summer programs
Summer gaps by ward, based on student residence
Beyond capacity and need
As discussed in previous chapters, the data used to estimate capacity, need, and gaps for subsidized OST programs are incomplete and imperfect. Furthermore, it is important to note that these gap estimates do not consider constraints on families that could prevent them from participating in OST programs. In addition, the gap analysis only considers the number of seats available—not whether the associated programs match with families’ needs and preferences.
Many families do not or cannot participate in out-of-school time programs when slots are available. As Chapter Seven will explore, families have many constraints on their time and budgets, and many factors—from program hours that do not align with parents’ work schedules to transportation logistics to concerns about program quality or content—may prevent families from enrolling children and youth in afterschool or summer programs even if they would like to participate. Other families may prefer that children and youth return home after school or participate in enrichment classes or programs other than those discussed in this report. Older youth may choose not to attend out-of-school time programs because they need to work or care for a family member, or because existing program do not match up with their interests.
This report’s analysis of the capacity and needs for OST programs is not a strict analysis of supply and demand; such an analysis would require incorporating information on the costs of participation for families, which can go beyond program tuition and fees, as well as costs and financing considerations for providers. Any discussion of demand and supply without consideration of these costs will be incomplete.
Detailed information on where D.C. public school students live and go to school, capacity of OST programs and locations, spatial analyses of where programs are located in relation to students, and the experience of providers and families can be found in the main text of our report.
Endnotes
- For details, see Afterschool Alliance, 2020.
- If the Afterschool Alliance findings are correct, then there are as many unserved children and youth in the District of Columbia as those who are served. For afterschool programs, this number could be as high as 36,360 at the earlier grade band, and 6,090 at the high school level. It is important to note that these numbers are driven by capacity estimates. Not all seats are taken, and some seats are not used regularly.
- This is the total enrollment at District’s public schools (DCPS and public charter schools) in grades PK3 through grade 12. The source of this data is the student level data received from DME.
- The 2017 report had relied on four metrics, ordered in the number children and youth who would have to be served in descending order: universal coverage, broad income targeting (130 percent of FPL), at-risk, and narrow income targeting (100 percent of FPL). We were surprised to see that the number of children and youth who would have to be served under the “at-risk” target became larger than 130 percent of FPL in 2021. For this reason, we added another income target set at 300 percent of FPL. It is important to note that one should take care in comparing the two reports as target definitions have changed.
- In D.C., there is no separate CHIP program. Children under 319 percent of federal poverty level could be enrolled in Medicaid. For details, see https://www.medicaid.gov/medicaid/national-medicaid-chip-program-information/medicaid-childrens-health-insurance-program-basic-health-program-eligibility-levels/index.html.
- Estimates for the number of children and youth eligible for CHIP and under 100 percent of FPL are based on the distribution of enrollment between elementary, middle, and high schools. Children and youth in poverty is based on poverty levels for all children under 18, weighed by ward.
- For instance, research on programs for teens also suggests that even the most successful out-of-school time programs have participation rates of about 60 percent, and even lower retention rates (about 20 percent). American Youth Policy Forum. (2006).
- Public schools” includes both traditional public school and public charter schools.
- Appendix table 7 and Appendix table 8 provide additional details.
- That is, there is more overlapping among economic and academic disadvantages for older youth.
- The current definition for “at risk” includes children and youth who qualify for TANF or SNAP, children and youth who are homeless, children and youth in the District’s child welfare system, and high school youth who are at least one year older than the expected age for the grade in which they are enrolled.