
Out-of-school time (OST) programs, such as afterschool and summer programs, are important to many families the District of Columbia. Where programs are located is an extremely important factor for access to out of school time (OST) programs in the District. For some families, having programs located close to where they live might be the most helpful, whereas for others it might be most helpful for programs to be located near where children go to school. This article presents analyses of current coverage, defined as the number of OST seats by ward compared to the total number of public school students who live in that ward as well as the number of students who attend school in that ward. It also develops metrics of exposure, which shows proximity of OST seats to children and youth weighted by the number of students.
About this series
This publication is part of a series adapted from our full report commissioned by the District of Columbia Deputy Mayor for Education (DME), Needs assessment of out-of-school time programs in the District of Columbia.
Other publications in this series include:
- Chart of the week: D.C. children face unequal access to out-of-school time programs
- Demand for out-of-school time programming shifts, depending on where students live versus where they go to school
- How many out-of-school time seats D.C. has, and where they’re located
- How many more out-of-school time seats does the District of Columbia need?
- Who provides of out-of-school time programs in the District of Columbia?
- Out-of-school time programs in the District of Columbia: Parent and guardian experiences
- Recommendations for out-of-school time programs in the District of Columbia
Access the underlying original report in printable PDF format here.
Where programs are located is an extremely important factor for access to out of school time (OST) programs in the District. In fact, transportation to and from out of school time programs was named by parents and guardians as one of the main barriers to participation in OST programming. For some families, having programs located close to where they live might be the most helpful, whereas for others it might be most helpful for programs to be located near where children go to school.
This section presents analyses of current coverage, defined as the number of OST seats by ward compared to the total number of public school students who live in that ward as well as the number of students who attend school in that ward. It also develops metrics of exposure, which shows proximity of OST seats to children and youth weighted by the number of students. These metrics are important because they provide a sense of the abundance (or lack) of OST seats within each ward.
Coverage by ward
After school programs
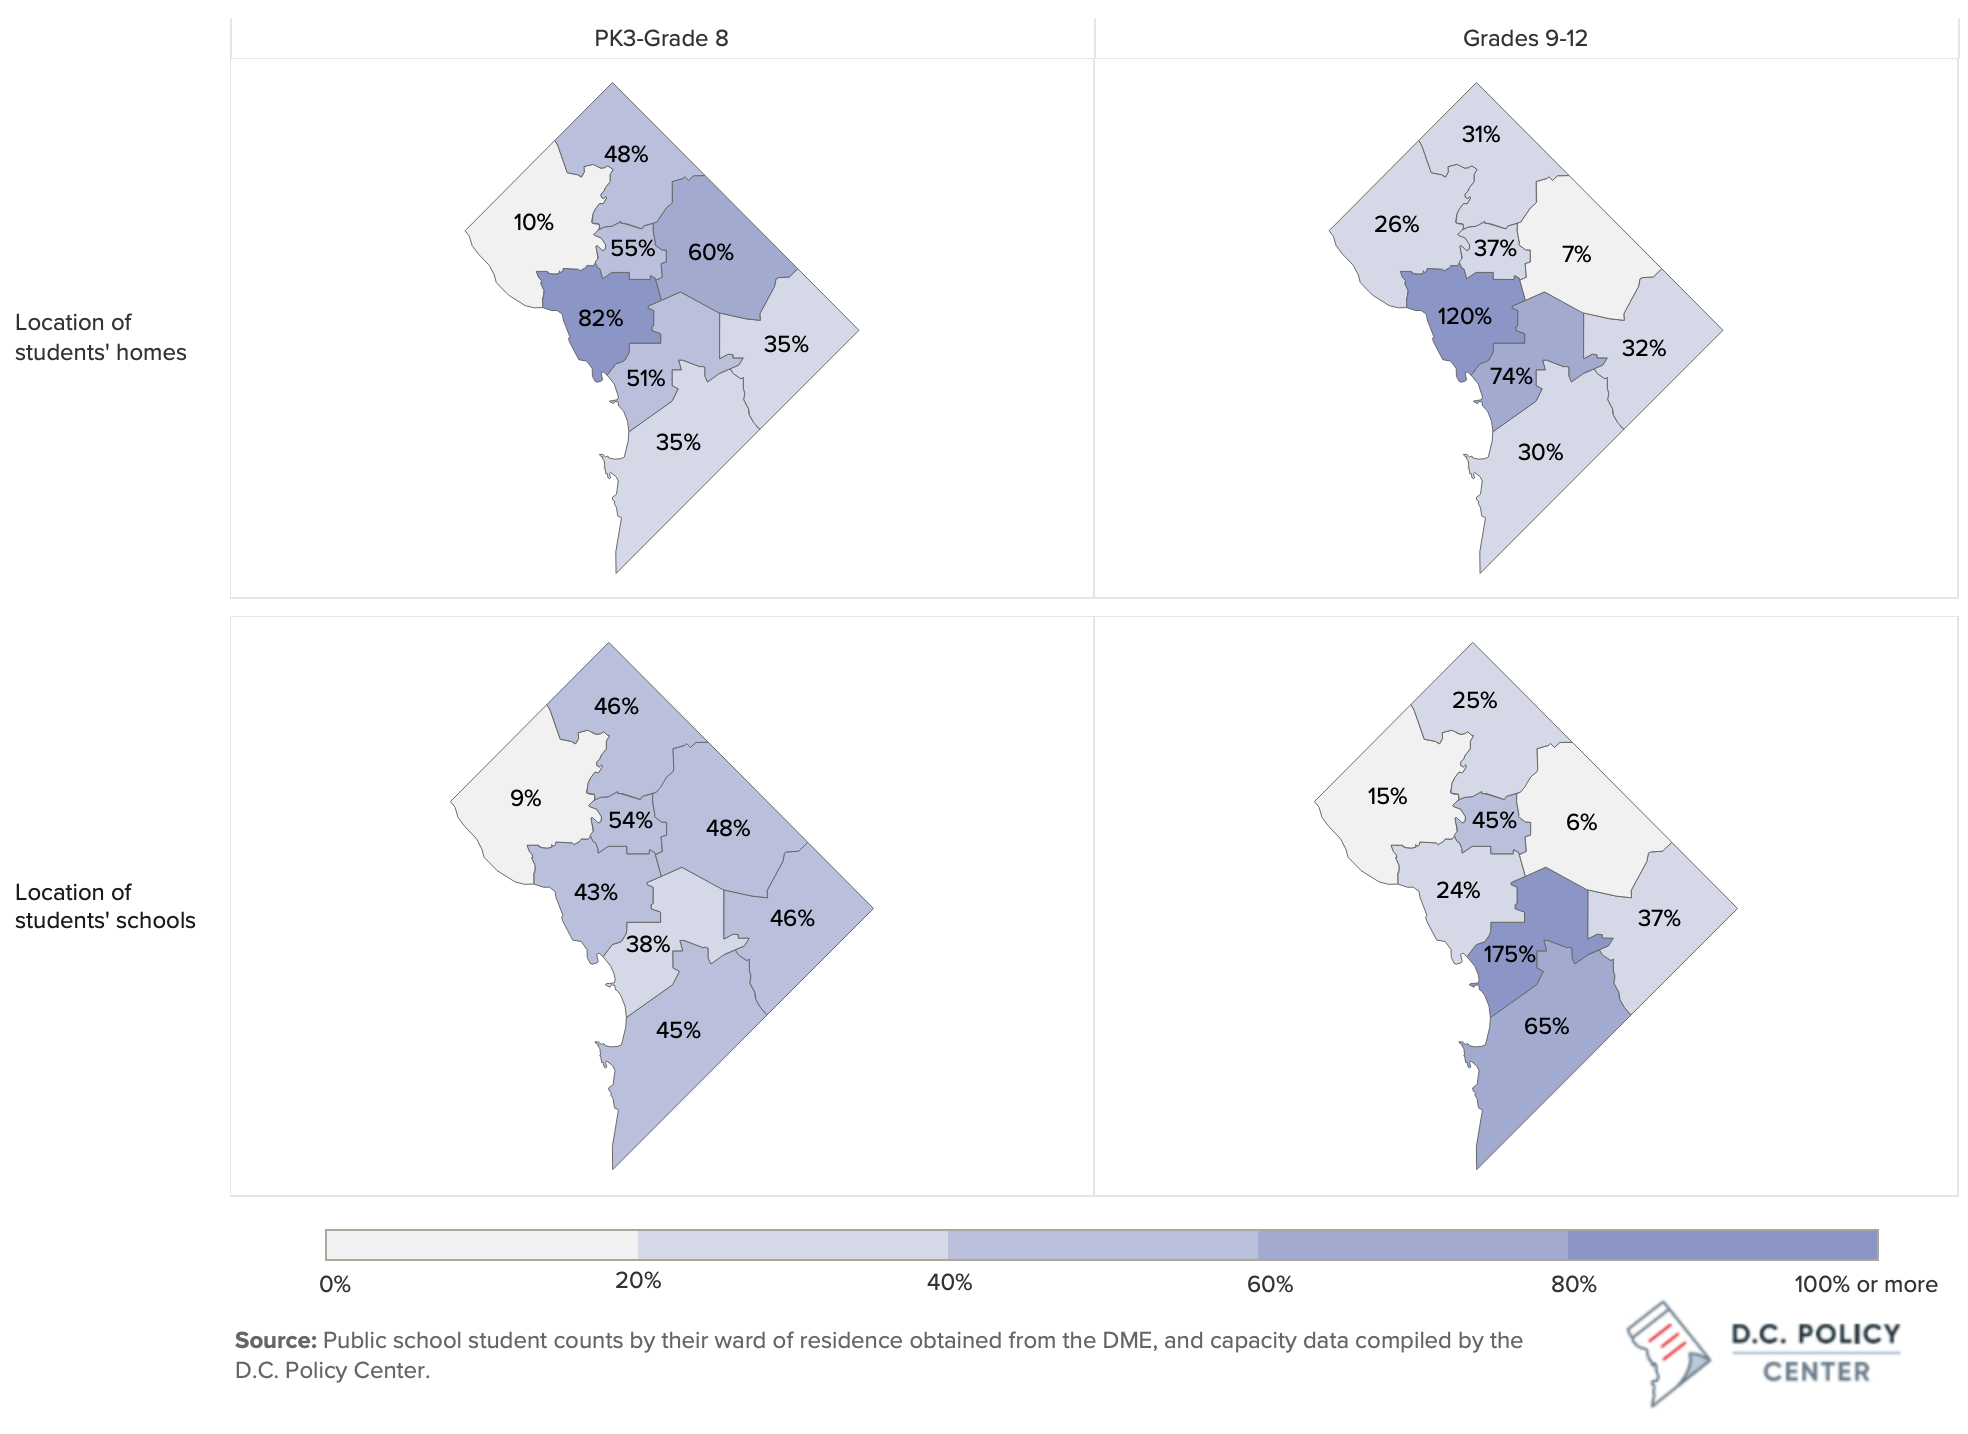
Across the entire city, the number of seats in afterschool programs for students attending PK3 through grade 8 is the equivalent of 43 percent of all public school students enrolled in these grades. This number is much greater than what has been reported for DC at the national level: The Afterschool Alliance found that in 2020, extrapolated from parent surveys that 24 percent of all children and youth had access to after school programs.1
Comparing PK3-grade 8 afterschool program seats in each ward to students who live in that ward, Wards 2 and 5 have the greatest coverage rate (82 percent and 60 percent respectively). But given that for afterschool programs, parents and students may need or prefer to attend an option closer to their school, especially at earlier grades, coverage calculated using students’ school locations is likely more relevant. The coverage picture changes considerably under this metric: Wards 2, 5 and 6 lose considerable ground because there are many more students attending school in these wards than living in them. Wards 7 and 8 have more favorable outcomes when comparing the number of seats to students who attend school there (as opposed comparing seats to students who live there) because many children and youth who live in these wards attend school in another ward.
For students who attend high school, the overall coverage ratio is 33 percent for after school programs. Ward level data should be interpreted with care since high school students are much more mobile and are more likely to attend school somewhere other than the ward where they live. Therefore, the coverage maps are even more sensitive to whether coverage is measured against students’ residence versus students’ school location. Importantly, Wards 2 and 6 stand out since these wards do not have a by-right school located in their boundaries.2 Ward 2 has relatively fewer residential neighborhoods and most of these include apartment buildings with small units. Therefore, the number of public school students who live there (506) is only a quarter of the number of public high school students who attend school there (2,082). Thus, its coverage ratio for afterschool programs when comparing seats to youth who live there (120 percent) is much higher than its coverage ratio calculated by comparing seats to youth who go to school there. Ward 6 also does not have a by-right high school and only three public charter schools which are open to all students from the city. Ward 6 is largely residential with 1,114 high school students living there but only 467 students attending school in the ward.
Coverage by ward for afterschool programs, by grade band and student residence
Summer programs
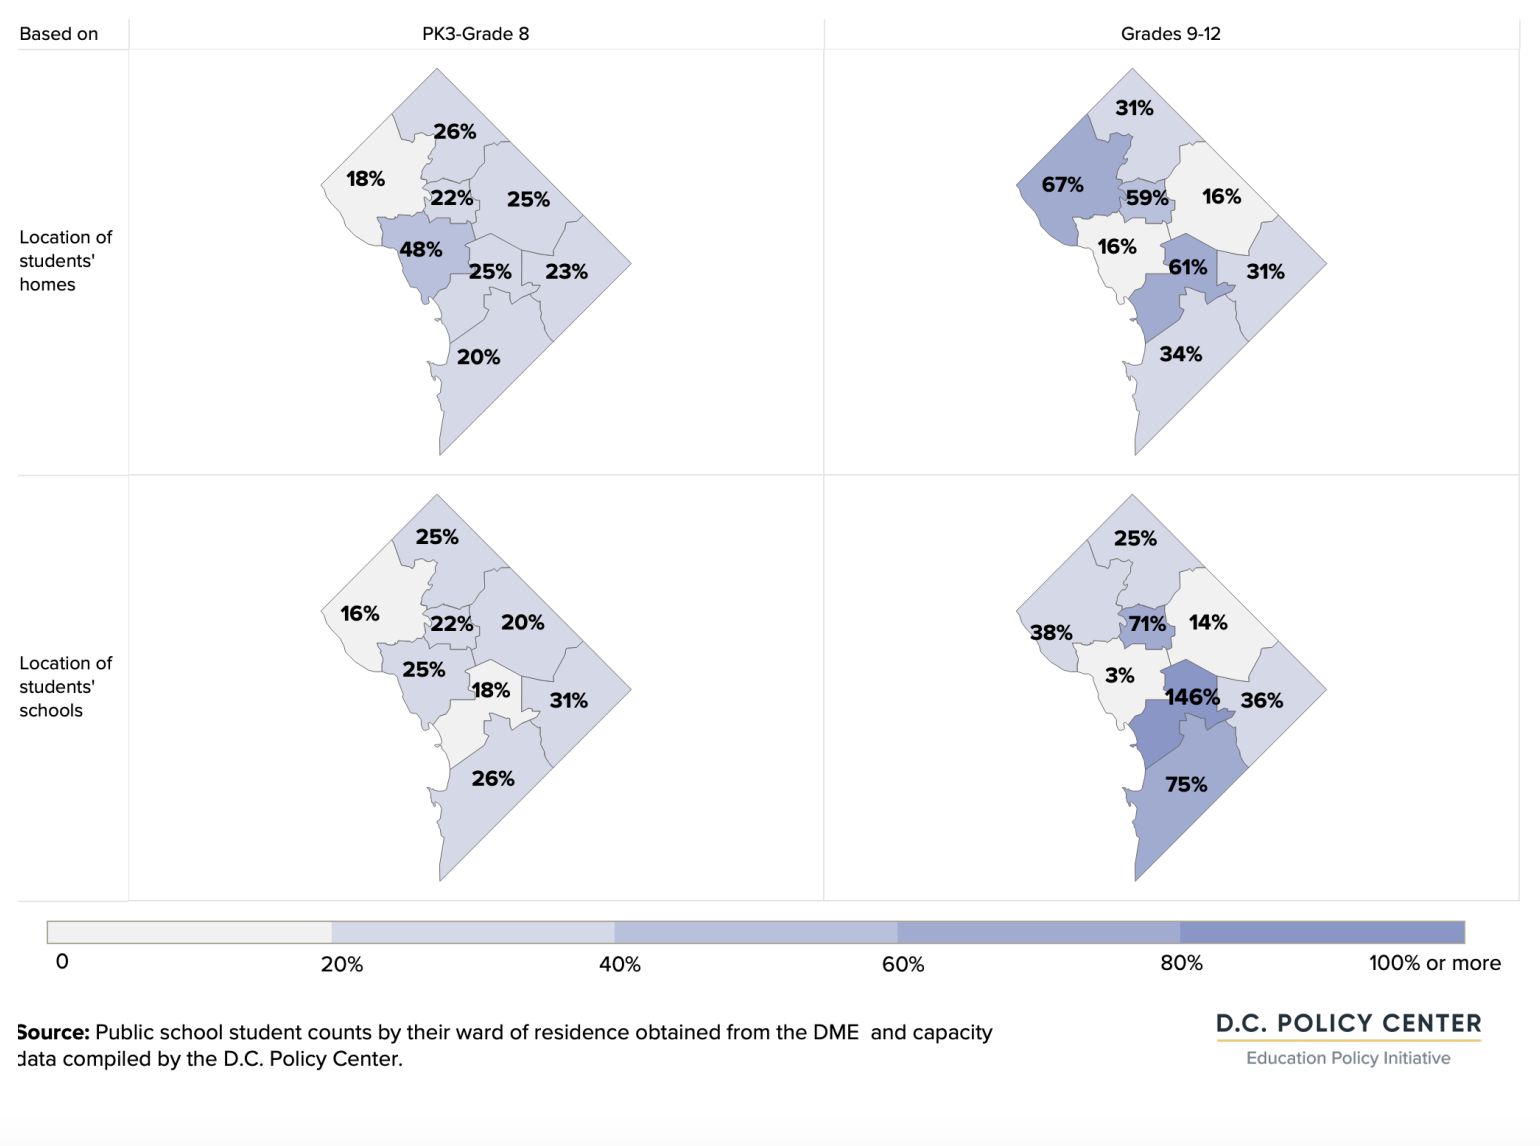
Coverage is much lower for summer programs serving students attending PK3 through grade 8, whether measured against where students live or where they attend school. Citywide, the summer program coverage rate is 23 percent for this grade band. Families and students may have different preferences for the location of summer programs. Since school is out of session for most students, OST programs’ proximity to home may be more important than proximity to school. Coverage ratios measured against two metrics vary greatly across some wards: in Ward 2, for example, available summer seats equate to 48 percent of PK3 through grade 8 students who live there (outperforming city average), and 25 percent of students who attend school there (about city average). Coverage is below 20 percent in Ward 3, regardless of how it is measured.
High school coverage ratio for summer programs is extremely high, at 97 percent across the city, but this is largely driven by the MBSYEP. When these seats are excluded, summer program coverage declines to 35 percent. Coverage, based on where students live, is highest in Wards 3 and 6 (67 percent and 61 percent respectively, and lowest in Wards 2 and 5 (16 percent for each ward).
Coverage by ward for summer programs, by grade band and student residence
Proximity to OST programs by where students live
While ward level analysis provides a broad understanding of the distribution of existing seats relative to the distribution of students and where needs are the greatest, this analysis cannot address the issue of proximity and access. Given that wards are large areas and that it is not always convenient for families to travel across a single ward, one must consider the location of and proximity to OST programs as factor in accessibility. Additionally, the number of students relative to the number of seats is important: in areas of the city where a lot of children and youth reside, there is potentially fiercer competition for existing seats. For example, Wards 7 and 8 have the most seats, but these wards also have the most students, meaning that the potential need is much higher.
To illustrate the importance of proximity, this report uses spatial analysis to determine the availability of OST seats within a certain distance of each census block where students live. This indicator combines information on supply (number of nearby seats) and need (number of children and youth competing for these seats) to how many seats are within a certain distance (a quarter of a mile, half a mile, etc..) of each census block students live in any direction (spanning a total of half a mile, one mile etc.).3
It is important to note that how close seats are to where student live may not be the best metric for spatial analysis. For example, it may be more important to have programs close to where students go to school, nearby to transit centers, or nearby to public facilities such as libraries and recreation centers. While we were able to provide coverage ratios based on school location at the ward level, we could not replicate the analysis at the census block level given how concentrated the school locations are in a relatively small number of census blocks. Where to prioritize program location is a decision that should be based on the needs of families, accessibility, and policy goals.
After school program proximity for PK3 through grade 8 students
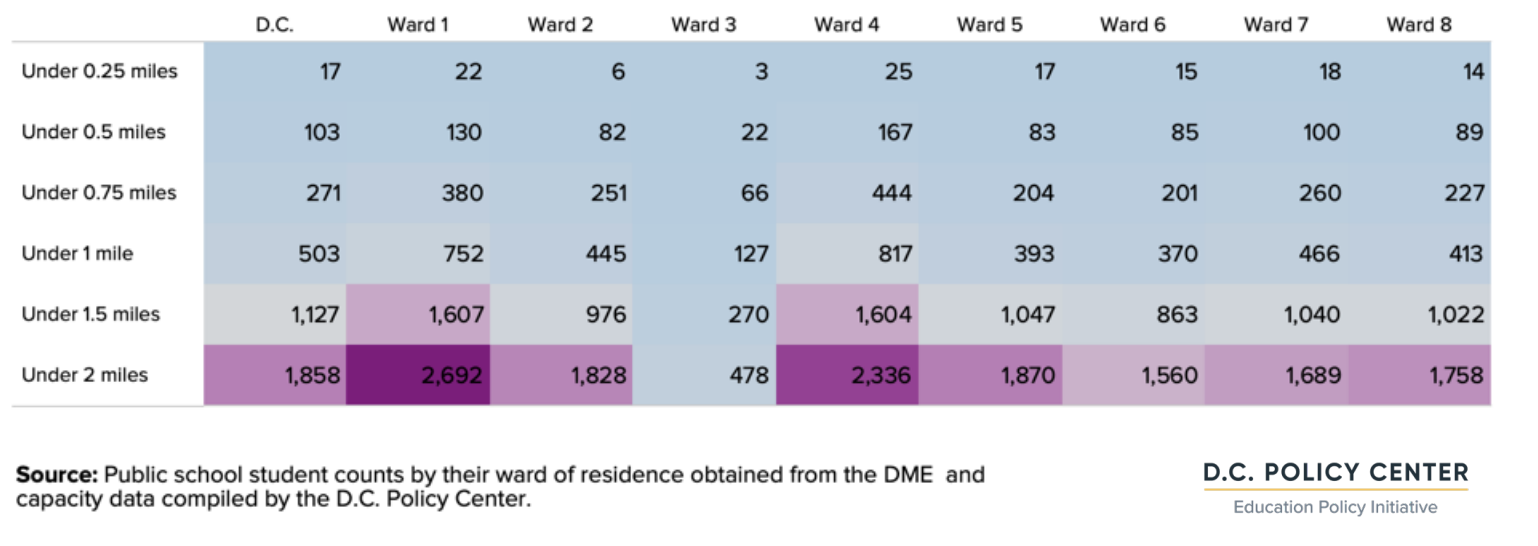
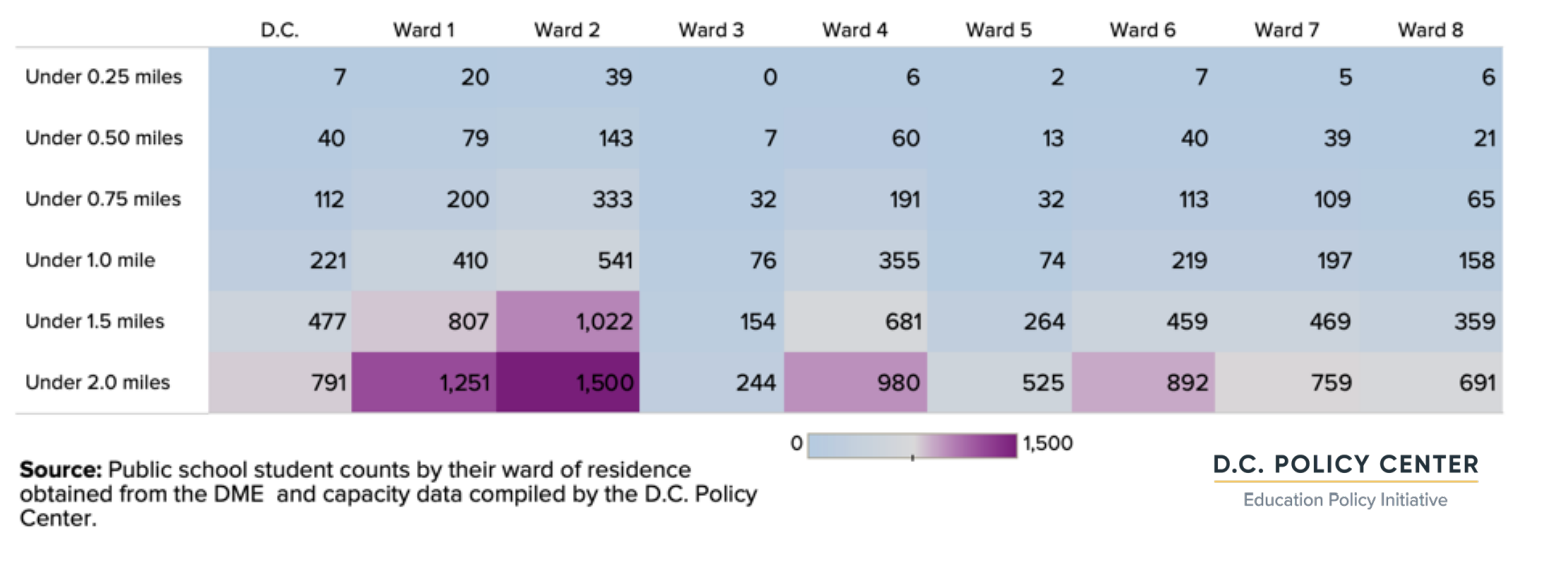
Across the city, there are 38 afterschool seats within a quarter mile of each student, averaged across the city. This number is greatest for Ward 2 (many more seats than students who live there, so there are, on average, 59 seats within a quarter of a mile of each student’s home) and lowest for Ward 3 (2 seats). At every distance, Wards 1, 2, and 4 consistently outperform the city average.
Cumulative count of afterschool seats by distance to student residence for PK3 to grade 8 (average by ward)
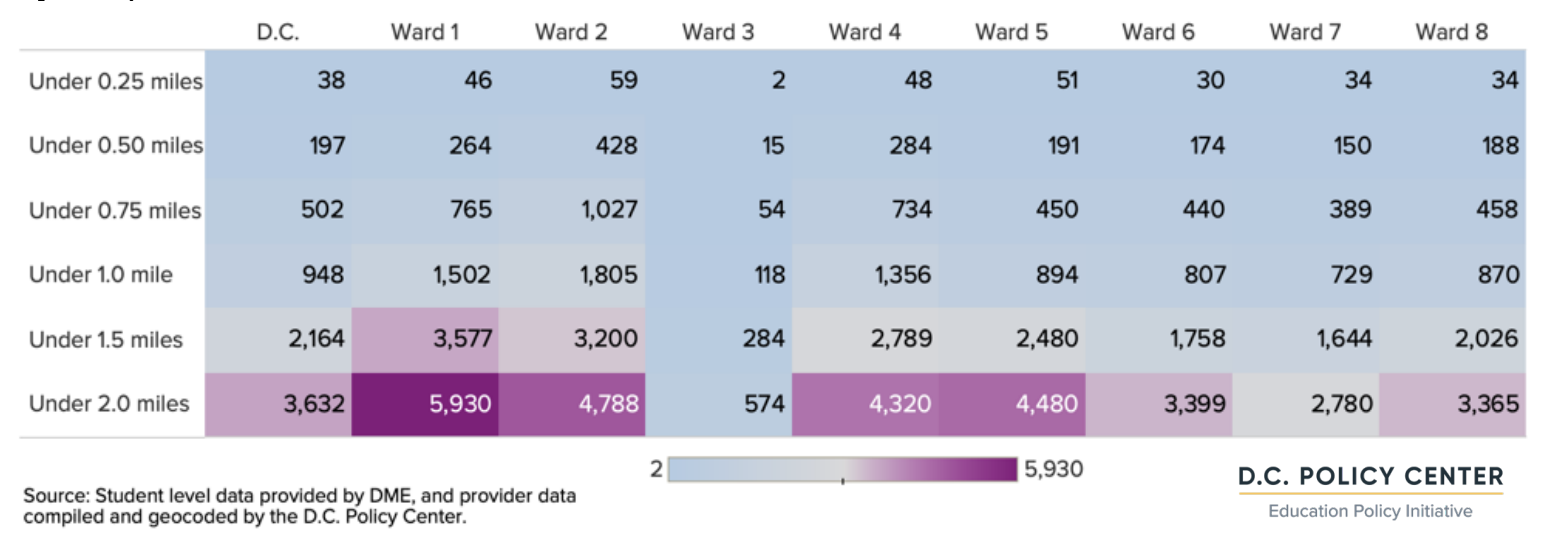
As shown in the capacity estimates chapter, Wards 7 and 8 have the highest number of seats relative to other wards, but these wards also have the highest number of students, as well as lower housing density. These factors result lower-than-city-average seats in close proximity to students’ homes.
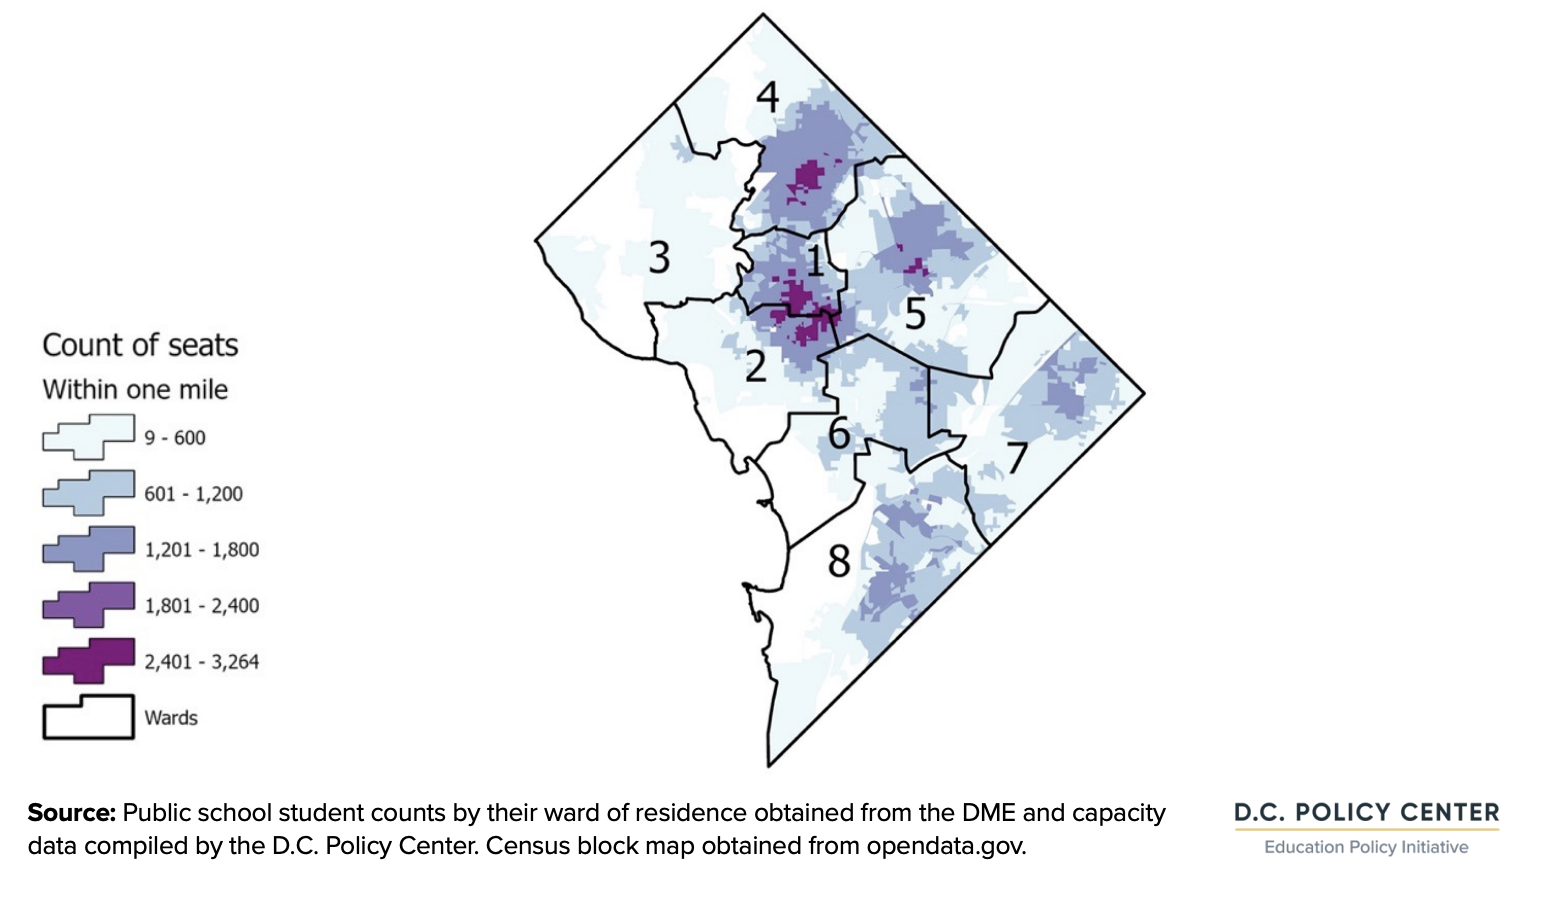
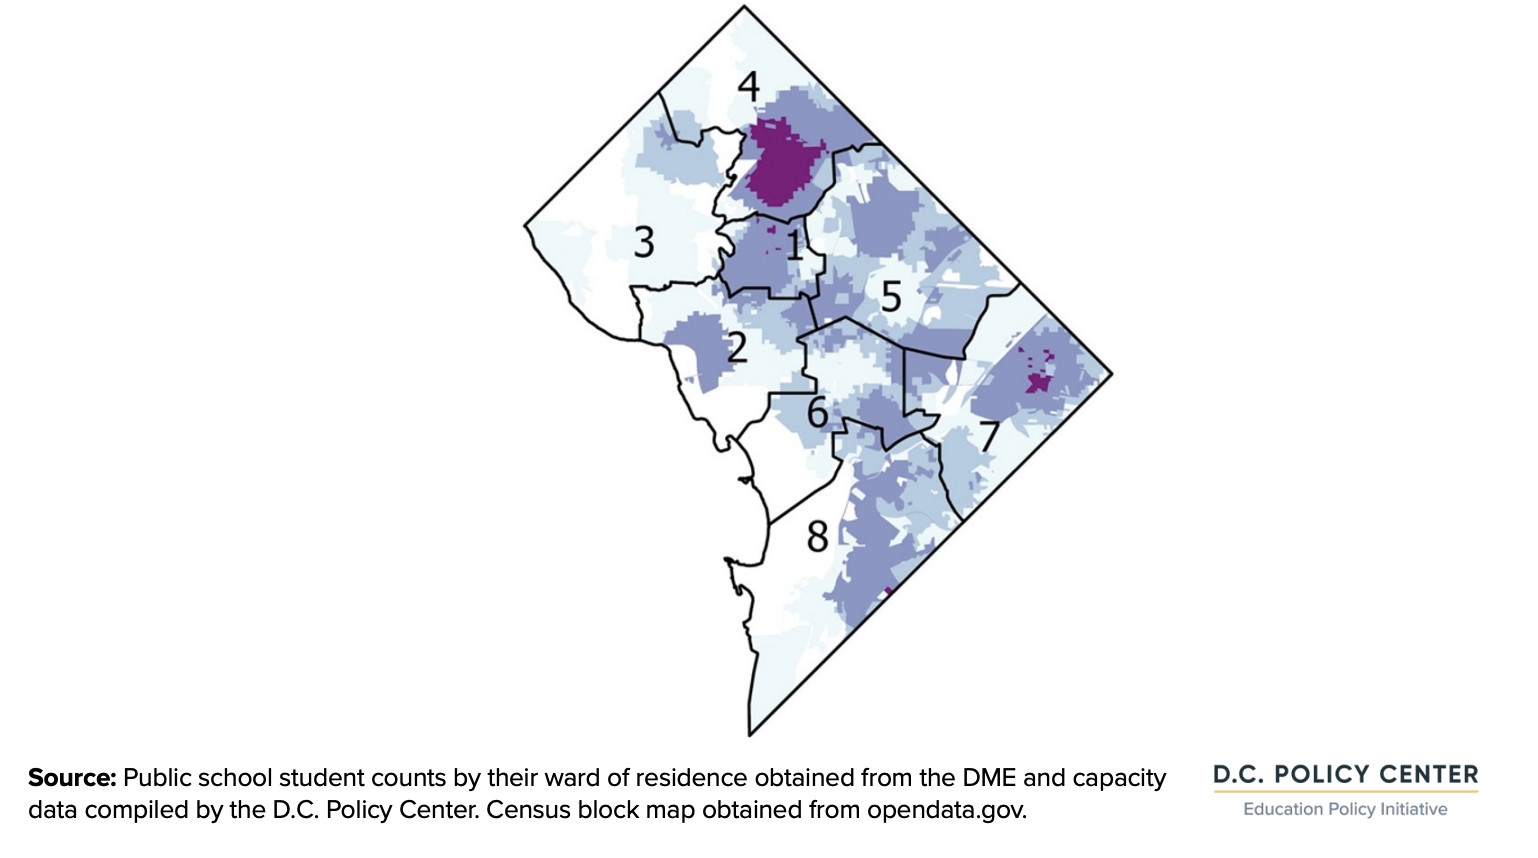
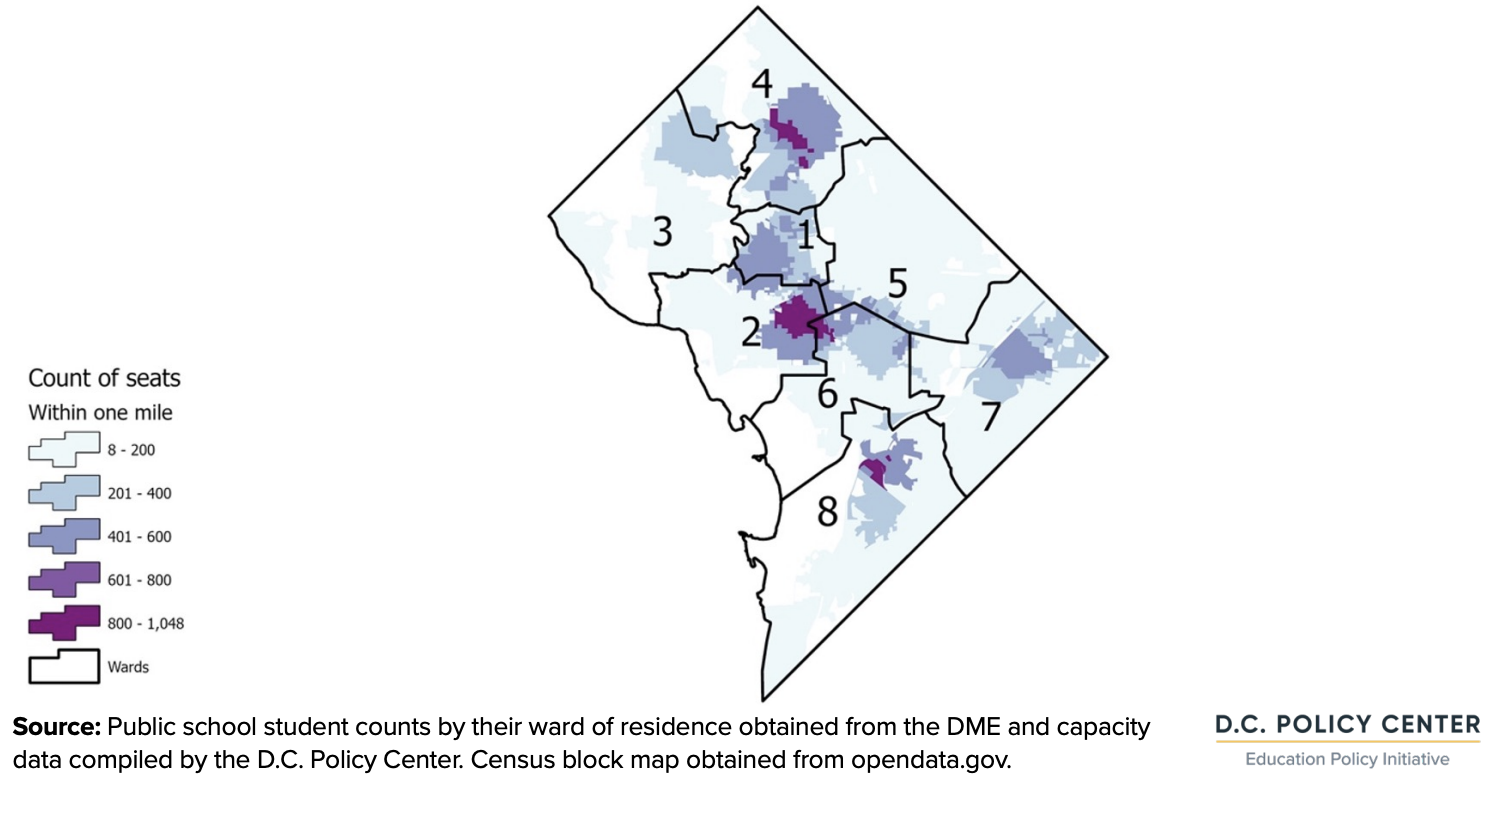
The combined effect of these factors—availability of seats, number of students, and the proximity of these seats to students—is better observed when the calculations presented in the table above are repeated at the census block level. As seen in the table above, there are, on average 948 afterschool seats within one mile of students who attend PK3 through grade 8. The darkest purple areas shown in the map have over 2500 seats per student. Ward 3 and large swaths of Wards 6, 7, and 8 stand out in this map for their relative dearth of seats.
PK3 to grade 8 afterschool seats within one mile of students’ homes
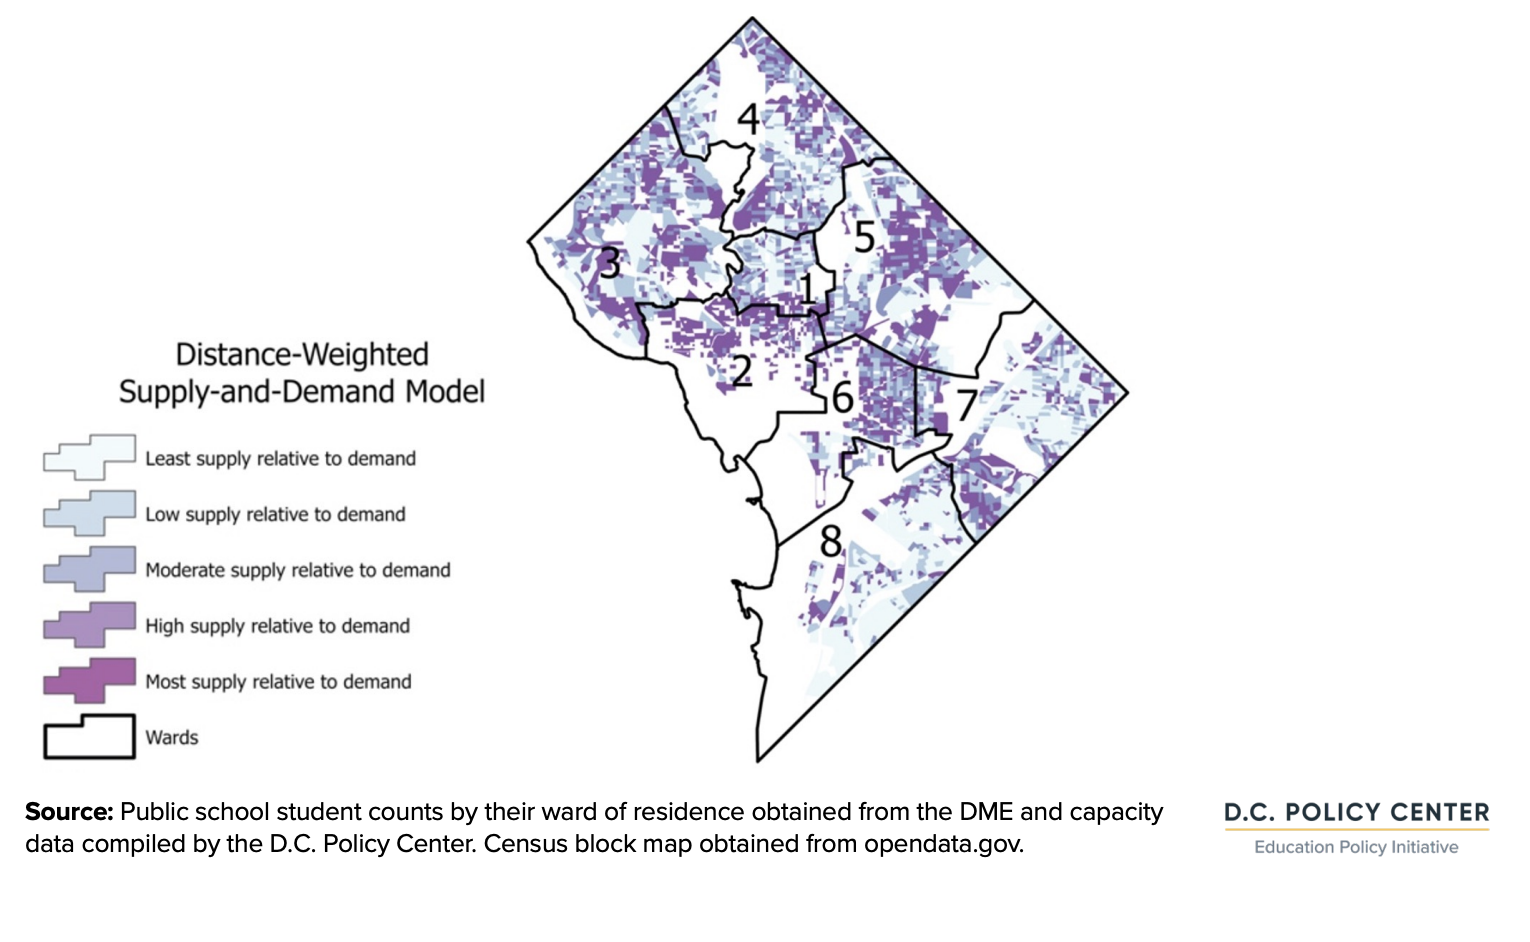
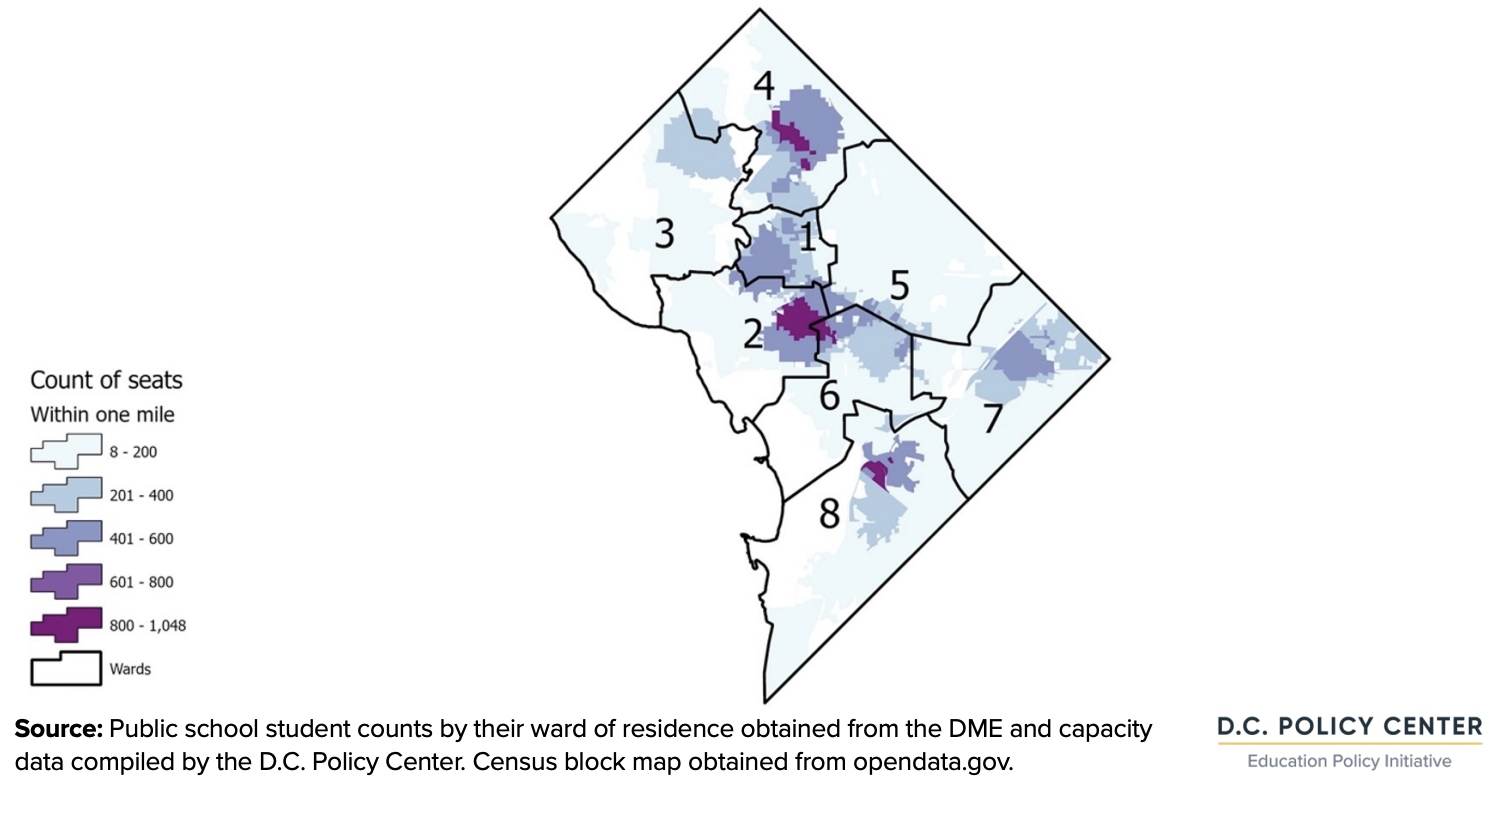
What if families were willing to travel longer distances for afterschool activities? This is particularly relevant in D.C., as many students attend a school other than their by-right school, and if they attend afterschool programs at their schools, then families must travel the longer distance from school to home. To capture this, we built a distance-weighted supply and demand model, which assumes that every seat is potentially open to every student, but families attach greater weight to nearby seats and a lower weight to seats that are further away. This assumes that programs closest to where children live are most accessible and that in areas where there are large amounts of students, there will be greater competition for OST seats (For more information about the models used in this section, please see the Methodology chapter of the Appendix.)
When adjusted this way, the map looks very different because it is capturing every census block in which a student lives, but the colors get darker if there are more seats nearby relative to the number of students. With these changes, Wards 2 and 3 light up, because there are more seats that are closer to the relatively fewer children living there. In contrast, in certain areas in Ward 7 and 8, where more children live, there are very few afterschool seats serving students attending PK3 through grade 8.
Distance-weighted supply and demand model for afterschool seats, PK3 to 8th grade, school year 21-22
Summer program proximity for PK3 to grade 8 students
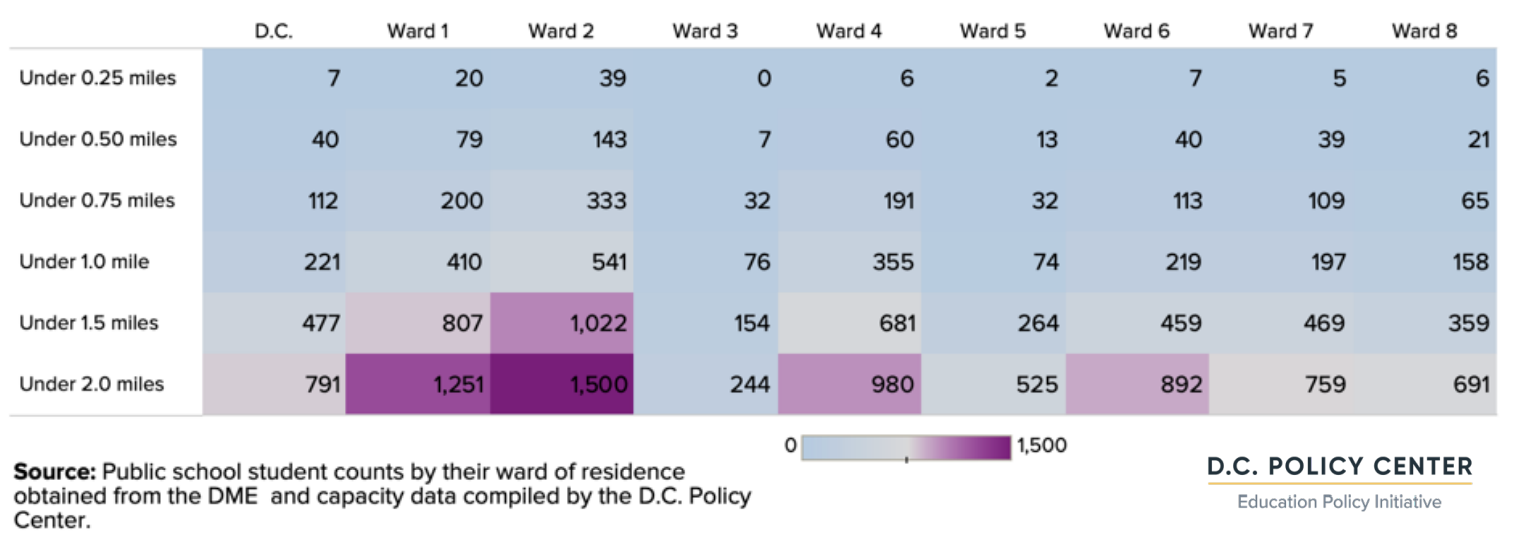
On average, there are 503 summer seats serving student attending PK3 through grade 8 within a mile of the student’s residences, These numbers are highest for Wards 1 and 4, but as the following map shows, the Ward 1 number is largely driven by a small location with an exceptionally high number of seats. The map of PK3 through grade 8 summer seats within a mile of where students live shows that summer seats are more evenly distributed across the city than afterschool seats, but at the same time, there are very high concentrations of OST seats in Ward 4, Ward 1, and Ward 7 relative to the location and number of students. Given that nearly half of public-school students live in Wards 7 and 8, there is relatively lower supply in those areas than what would be needed for equal access across the city (based on where students live).
Cumulative count of summer seats by distance to student residence for PK3 to grade 8 (average by ward)
PK3 to grade 8 summer seats within one mile of students’ homes
Afterschool proximity for high school students
There are fewer high school OST seats available than elementary and middle school seats, especially when excluding the MBSYEP (which was not mapped in this analysis, given that the data is by participant residence rather than program location). Due to the reduced number of seats, exposure maps show that there are much fewer program seats in proximity to where students live.
Wards 2 and 4 show relatively high supply, containing pockets where there are over 800 seats available to high school students within one mile. Supply is low in Wards 5 and 3, and Wards 7 and 8 only have concentrations of seats in central areas of the wards. These distributions, like those for afterschool, are weighted by the number of students living in each area. As such, even though some wards have high raw numbers of program seats available, they are not proportional to the number of students who live in those wards.
Cumulative count of after school seats by distance to student residence for high school (average by ward)
High school afterschool seats within a mile of student residence
Summer program proximity for high school students
Seats are most concentrated around students in Ward 1, with the second largest concentration in Ward 4. Ward 8 has two small concentrations of seats, and the rest of the wards have relatively few seats compared to the residence and number of students.
This calculation of seats in relation to students does not include the MBSYEP, which accounts for almost half of all summer OST seats for high school students, because data were not available on where programs were located. The inclusion of these seats in our spatial analysis may influence the distribution across the city.
Cumulative count of summer seats by distance to student residence for high school (average by ward)
High school summer seats within a mile of student residence
Detailed information on where D.C. public school students live and go to school, capacity of OST programs and locations, estimated gaps across the city and at the neighborhood level, and the experience of providers and families can be found in the main text of our report.
Endnotes
- Afterschool Alliance (2020), America After 3 PM.
- Ward 2 has three city-wide DCPS schools serving high school students and two public charter schools. Ward 6 has three public charter high schools.
- It is important to note that these maps show the supply of OST seats relative to student’s residence and does not consider where they go to school or ability to travel to other wards. The methodology does not allow us to do the same analyses based on where students go to school. This is because there only a handful of census blocks that hold schools, and the methodology requires a large variation in census blocks.