

Out-of-school time (OST) programs, such as afterschool and summer programs, are important to many families the District of Columbia. In addition to the number of out of school time (OST) seats available, it is important for the types of programming and services offered by providers to meet the needs of students. To learn more about program characteristics, times programs are offered, and what kinds of services and staff programs have, the D.C. Policy Center administered two surveys to providers of OST programs. This article describes provider characteristics identified through the responses to the surveys and discusses issues frequently mentioned by providers.
About this series
This publication is part of a series adapted from our full report commissioned by the District of Columbia Deputy Mayor for Education (DME), Needs assessment of out-of-school time programs in the District of Columbia.
Other publications in this series include:
- Chart of the week: D.C. children face unequal access to out-of-school time programs
- Demand for out-of-school time programming shifts, depending on where students live versus where they go to school
- How many out-of-school time seats D.C. has, and where they’re located
- How many more out-of-school time seats does the District of Columbia need?
- How close are out-of-school time programs to where students live?
- Out-of-school time programs in the District of Columbia: Parent and guardian experiences
- Recommendations for out-of-school time programs in the District of Columbia
Access the underlying original report in printable PDF format here.
In addition to the number of out of school time (OST) seats available, it is important for the types of programming and services offered by providers to meet the needs of students. To learn more about program characteristics, times programs are offered, and what kinds of services and staff programs have, the D.C. Policy Center administered two surveys to providers of OST programs.
One survey was distributed to CBOs (50 percent response rate), and another was distributed to non-Title I schools and public charter schools (78 percent response rate). The Policy Center received responses from 180 providers including 102 CBOs and 78 schools. This section describes provider characteristics identified through the responses to the survey, and discusses issues frequently mentioned by providers as pressure points or points of concern.
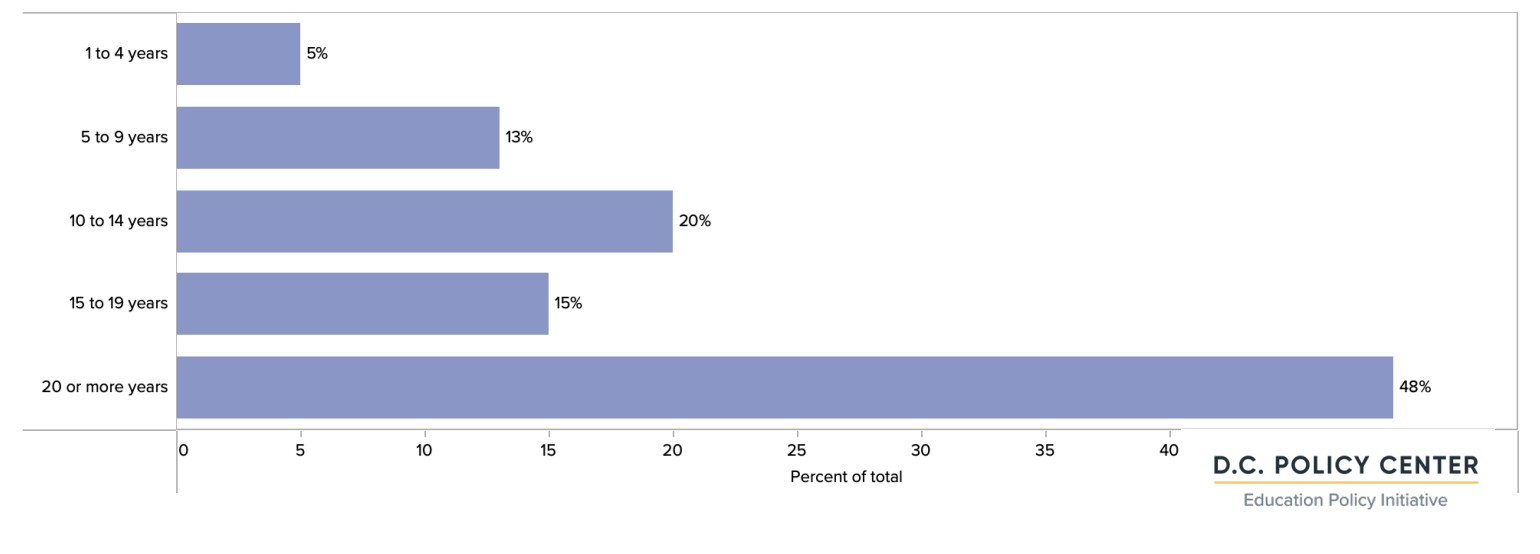
Most OST providers have been in operation for long periods of time.
Program age information has only been collected from CBOs. Their responses show that most CBOs that operate OST programs have existed for a long time. Nearly half the CBOs that responses to the D.C. Policy Center report operating for over 20 years, and over 80 percent of CBOs have been in operation for over 10 years.
CBO years of operation (reported in 2022)
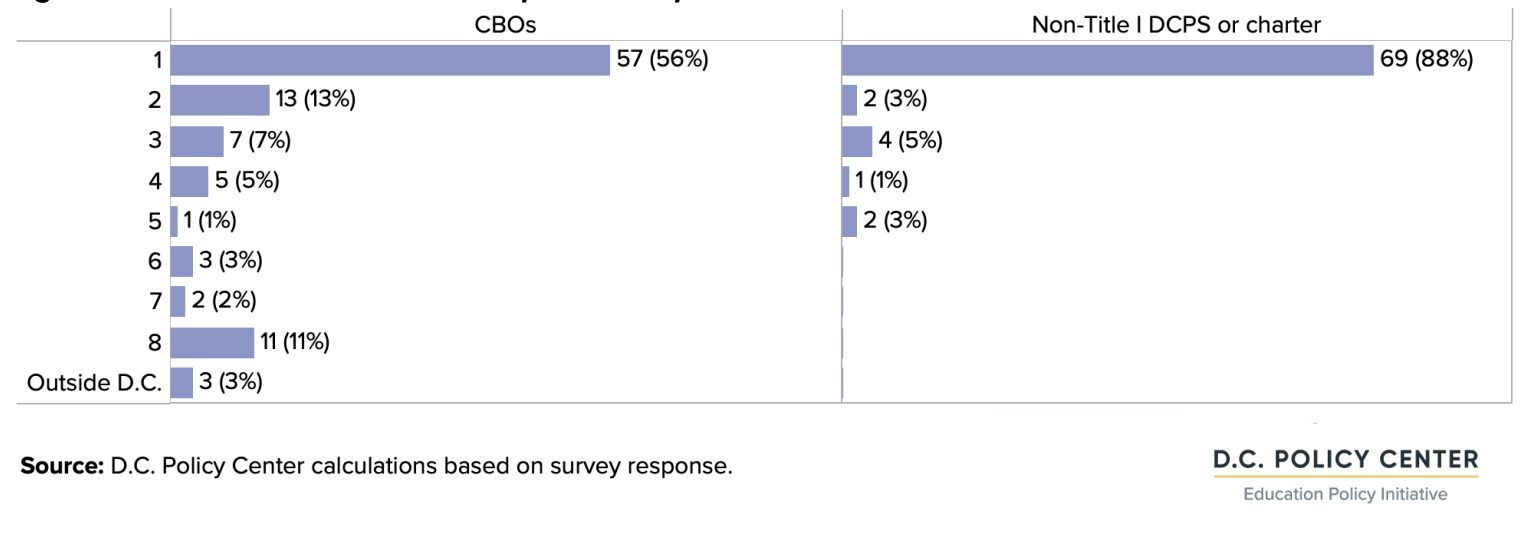
Most OST providers operate in a single ward.
56 percent of CBOs and 88 percent of non-Title I and charter schools operate in a single ward, and generally out of a single location. CBOs are more likely to operate in multiple wards, which is expected, given the nature of schools. Approximately 20 percent of CBOs operate in six or more wards, whereas no school operates in more than five wards. A small share of CBOs also operate programs outside of the District (for example, specific camp groups or nature centers), but these often serve D.C. students.
Number of wards in which providers operate
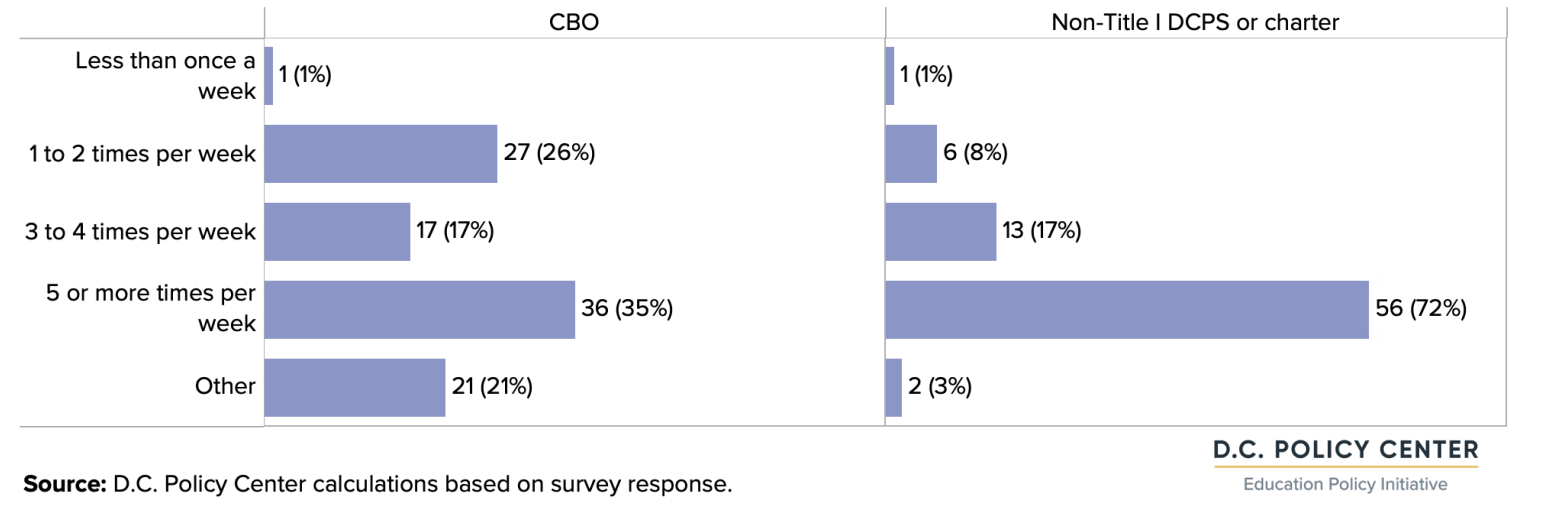
Most OST providers offer program five or more times per week.
It is rare to see OST programs that operate fewer than one day per week. Most CBOs and schools offer programs five days per week or more (56 percent of CBOs and 75 percent of schools). Schools are more likely to offer OST programs that run at least five days a week.
Frequency of programs by provider type
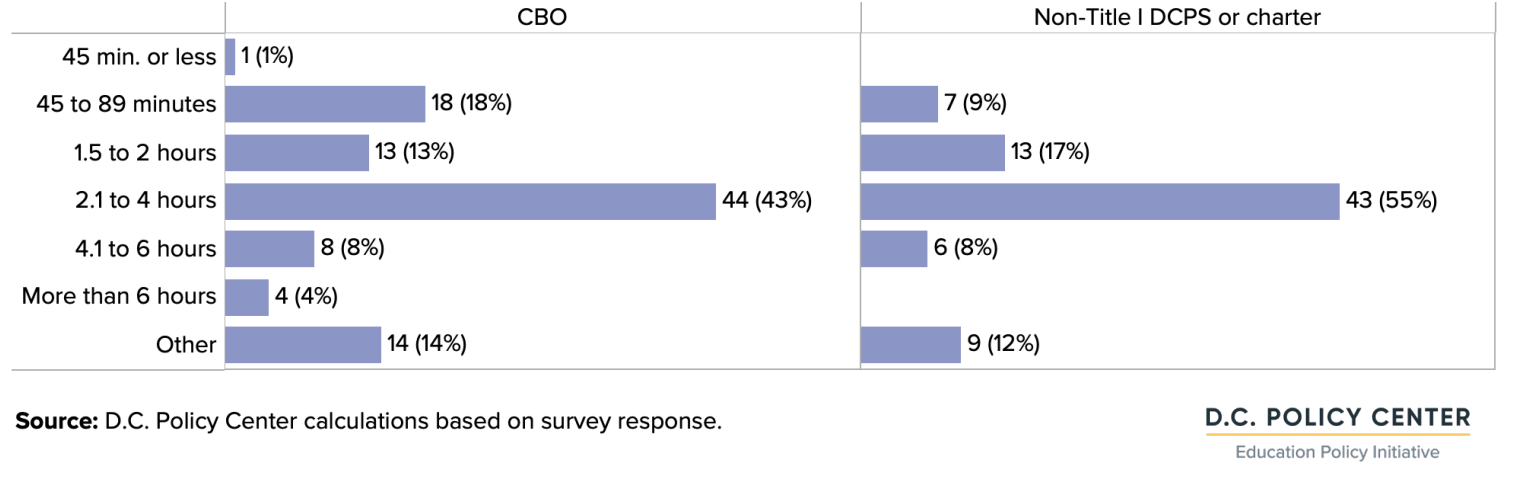
OST providers tend to offer programs that run between 2 to 4 hours per day.
Approximately 43 percent of CBOs and 55 percent of schools offer programs that run somewhere between 2 to 4 hours. A small share of CBOs offer programs that can last longer than 4 hours, but these tend to be over the weekends or during school closures. About one in five CBOs and one in 10 schools offer programs that last fewer than 1.5 hours per day. See Appendix Figure 5 for percentages by ward.
Duration of programs by provider type
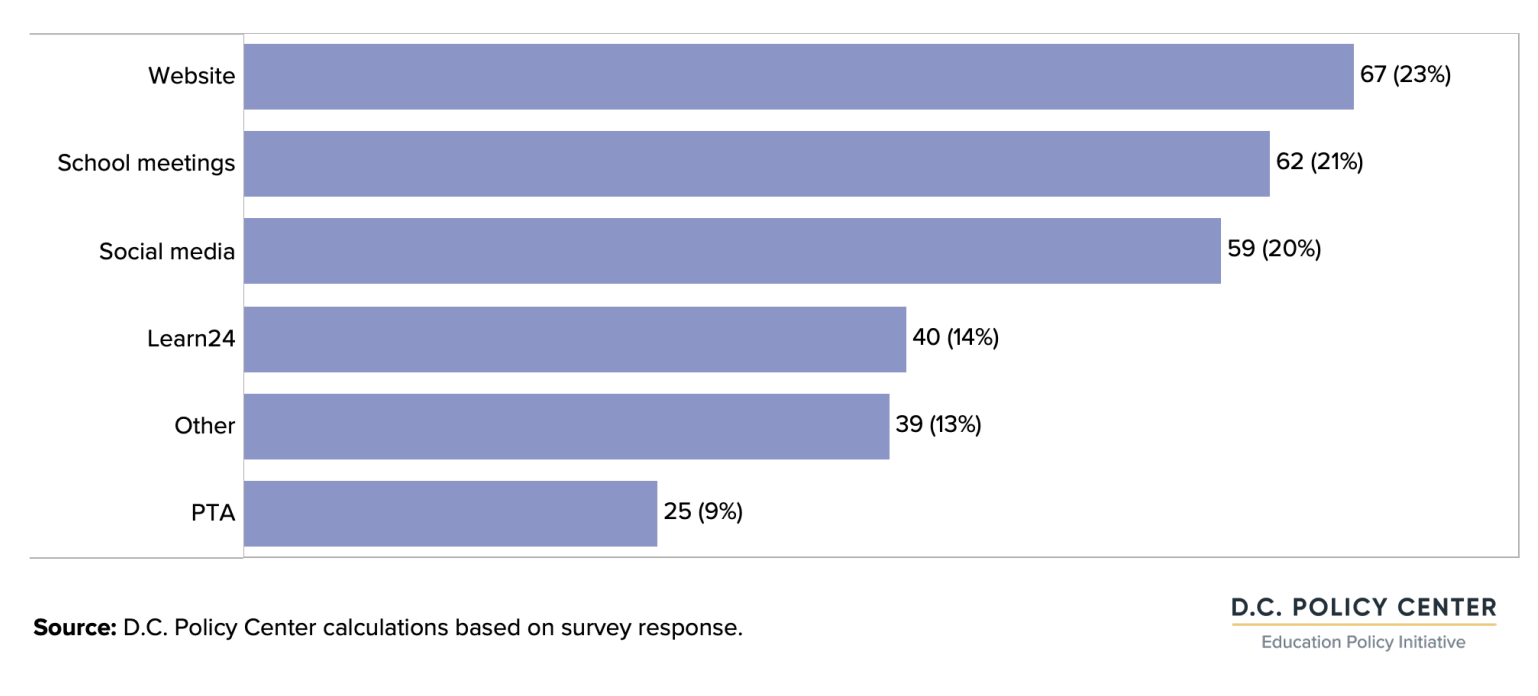
OST providers most frequently use school meetings, their websites, and social media to reach families.
For programs that are operated by schools, it is relatively easier to communicate with parents and students since schools themselves have established communications channels (email, text messages, or backpack mail) with parents. CBOs, however, do not generally have this option available to them. The D.C. Policy Center survey distributed to CBOs inquired about the most common methods of reaching out to parents or potential participants. These responses show that CBOs are most likely to use their website or social media or attend school meetings to inform parents and students about their program offerings. Only 39 percent of CBOs report using Learn24 as a means of information potential participants, and only 25 percent attend PTA meetings or use PTAs.
Number and share of CBOs that use various communication channels to inform families and potential participants.
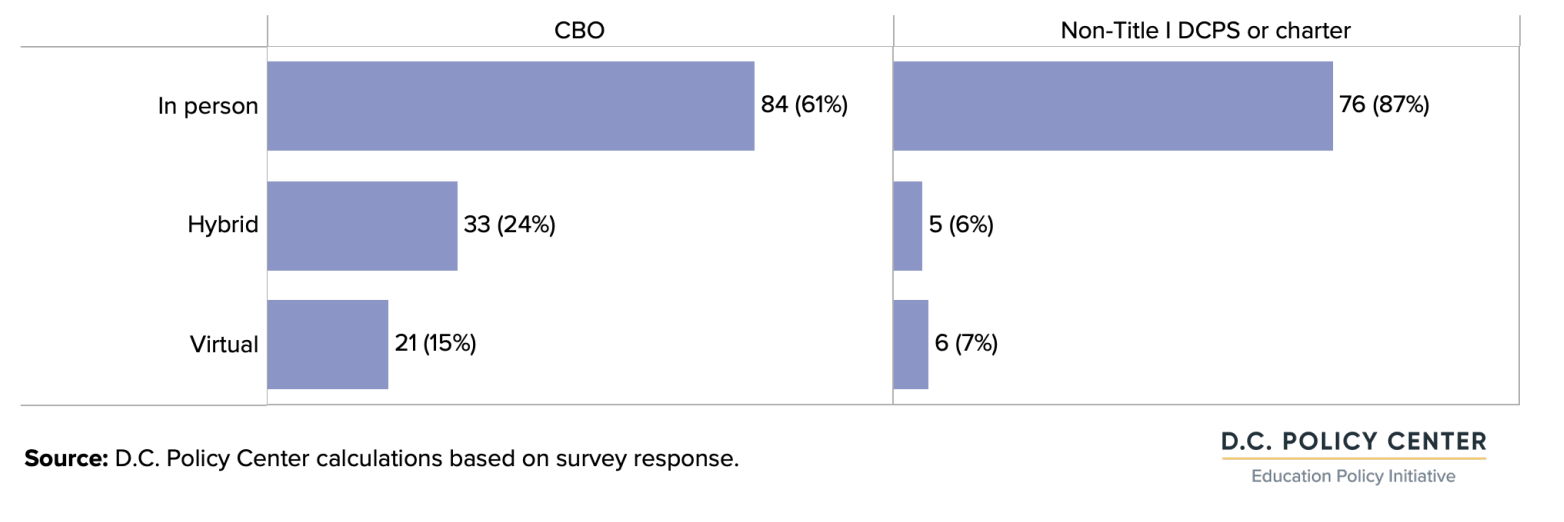
Most programs were offered in-person during school year 2021-22.
Among CBOs, 61 percent reported offering in-person programs. This share was even higher for schools—87 percent. Approximately 24 percent of CBOs and 6 percent of schools offered hybrid programs. Virtual programs were rare during that school year, especially among schools. Only six schools offered virtual programs (generally along with hybrid options).
In-person, hybrid, and virtual program options
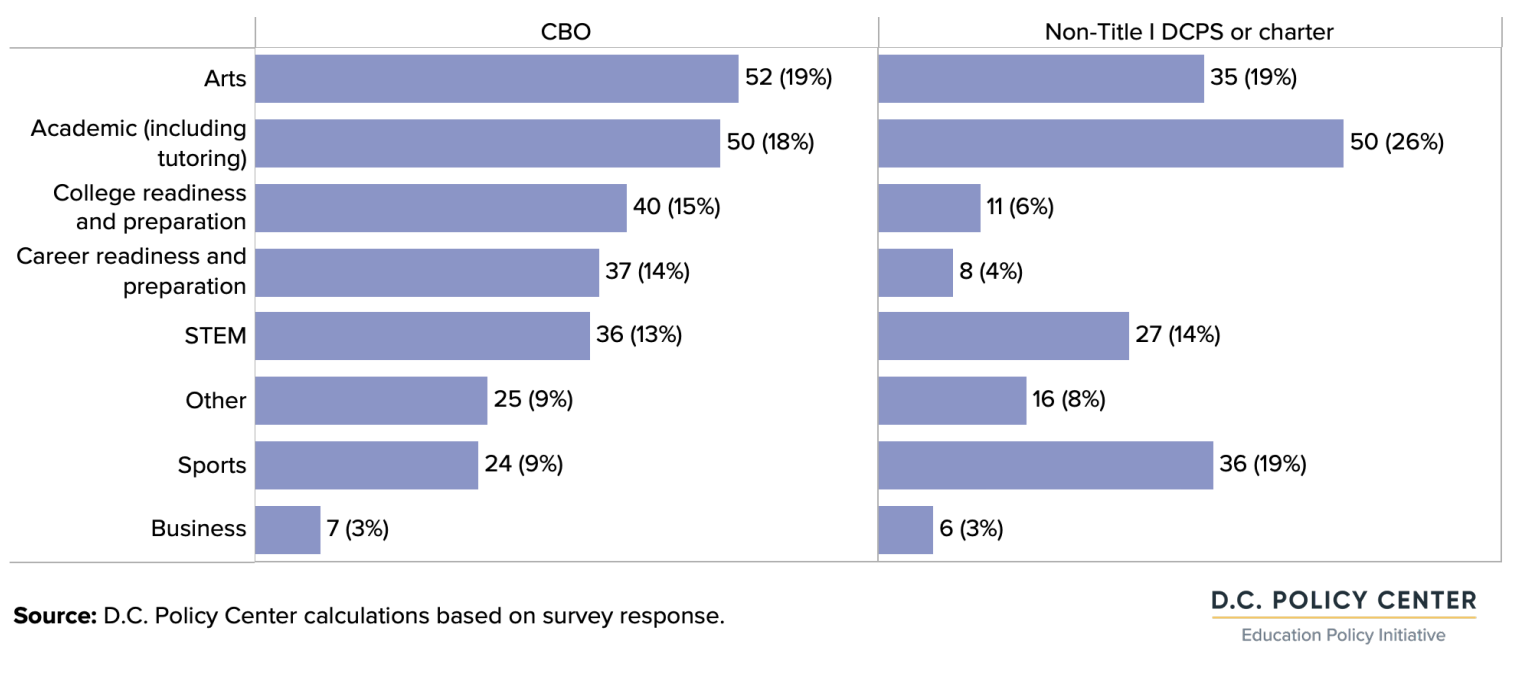
CBOs and schools focus on different areas in their OST programming.
Arts and academic programs (including tutoring) are the most frequently offered by CBOs and schools. CBOs are more likely to offer programs that are focused on college and career readiness, whereas programs organized by non-Title I and charter schools are more likely to focus on STEM and sports. Business-focused programs are relatively rare for both providers. Only seven CBOs and six schools reported offering OST programs with a business focus.
Number of providers by program type (and share in total providers)
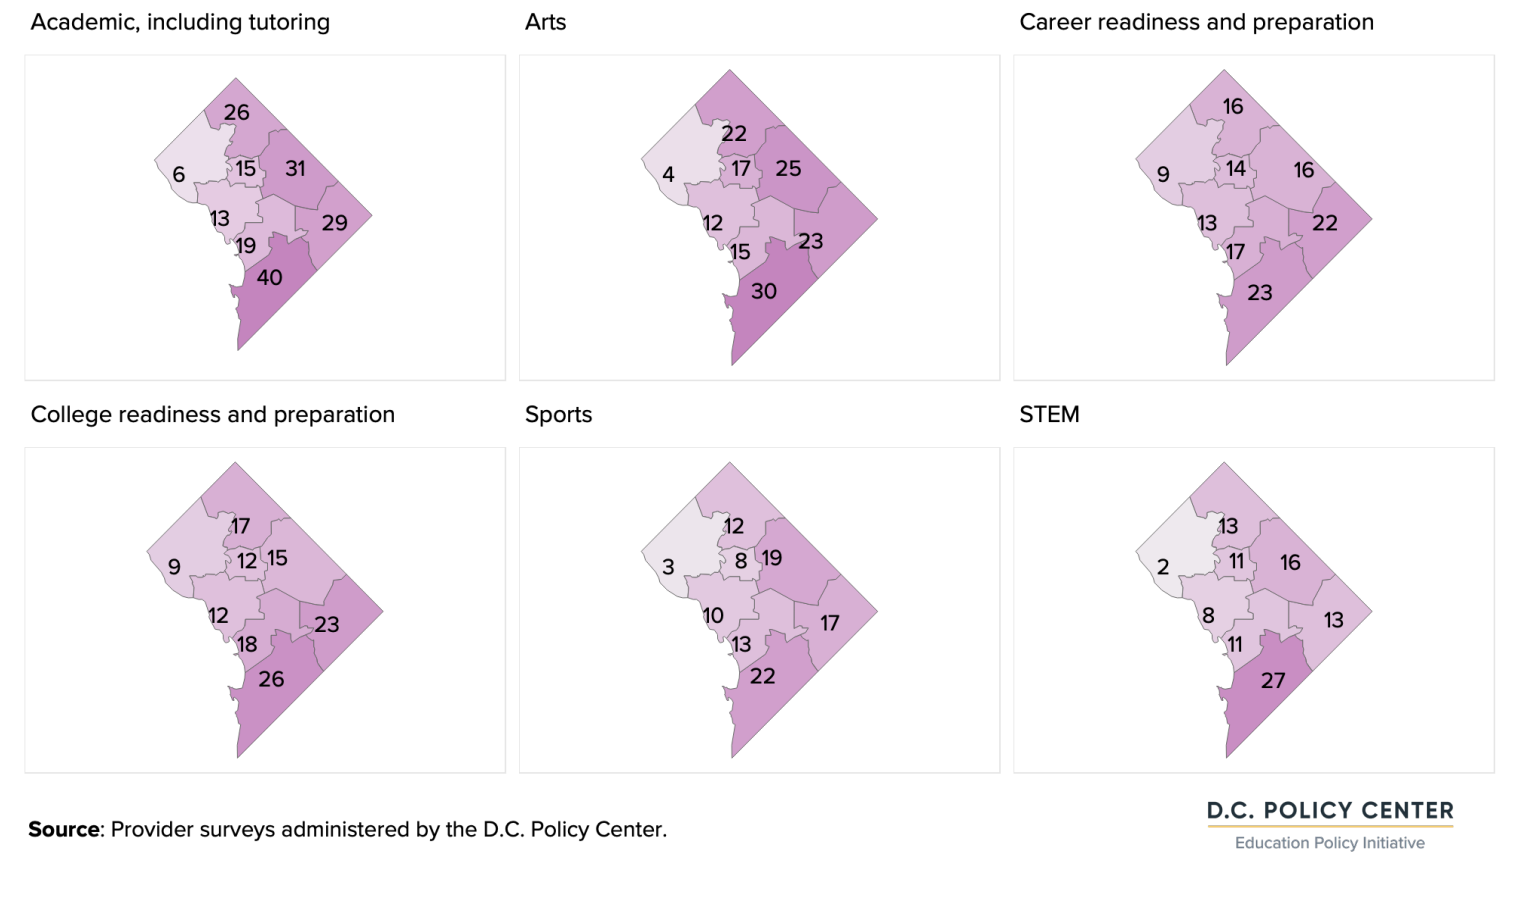
Program focus by ward
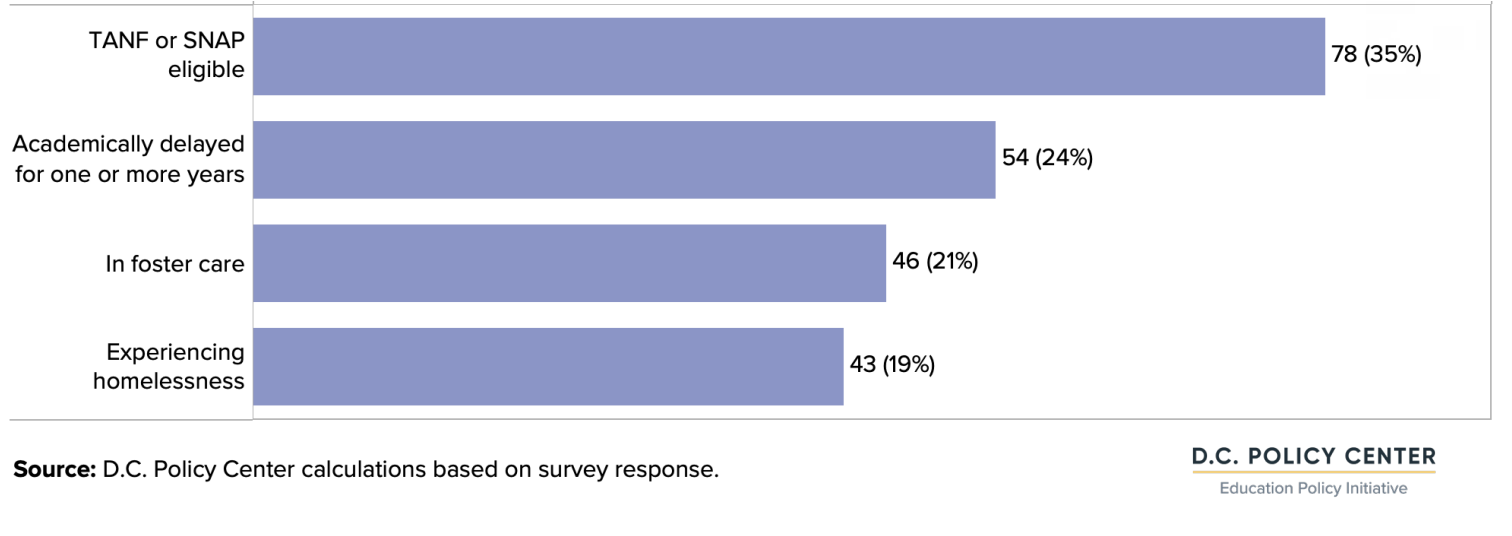
The majority of CBOs work with at-risk students.
Across the District’s public schools, approximately 49 percent of students are designated as at-risk for funding purposes. Through the D.C. Policy Center surveys, CBOs were asked about the various characteristics of at-risk students they serve. Their responses indicate that 76 percent of CBOs (78 respondents) serve at-risk students. The most common at-risk factor reported by CBOs is economic hardship (eligibility for TANF or SNAP programs). In addition, 53 percent of CBOs report serving students who are delayed at least one year (though these students might be attending PK3 through grade 8, and if this is the case, will not be officially designated as at-risk until they begin high school), 45 percent report serving students who are in foster care, and 42 percent report serving students who are experiencing homelessness.
Number and share of CBOs serving students with at-risk characteristics
CBOs and schools frequently serve special populations.
75 percent of CBOs and 85 percent of schools report serving special student groups in their OST programs. Providers are most likely to serve students with Individual Education Plans or 504 plans, English learners, and in the case of schools, students with disabilities. Approximately 45 percent of providers reported that they serve immigrant students, and about 30 percent reported serving undocumented students. 35 percent of the CBOs and 47 percent of schools also reported serving children and youth with mental health needs. These numbers are most likely underestimates since some providers do not track this information or were not able to answer this question.
Importantly, just because a program may be open to students with special needs does not mean that the program provides the support that students need. As such, additional research and resources may need to be devoted to determining what students need and how programs communicate what services they provide.
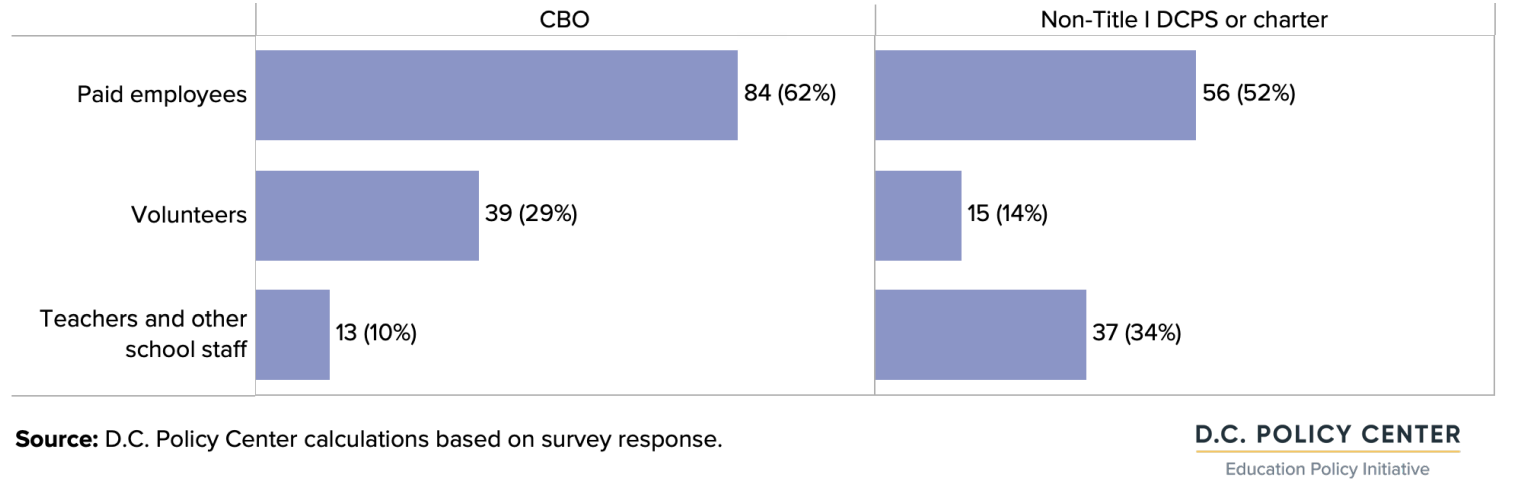
OST providers most frequently rely on paid employees to staff their programs.
82 percent of CBOs and 72 percent of non-Title I and charter schools report using paid employees to staff their programs. CBOs are far more likely to rely on volunteer staff (38 percent report doing so) than schools (19 percent). In contrast, nearly a quarter of schools report using teachers and other school staff to deliver OST programs. This share is only 6 percent among CBOs (and limited to CBOs providing programs in school locations).
Number and share of providers by their main source of staffing
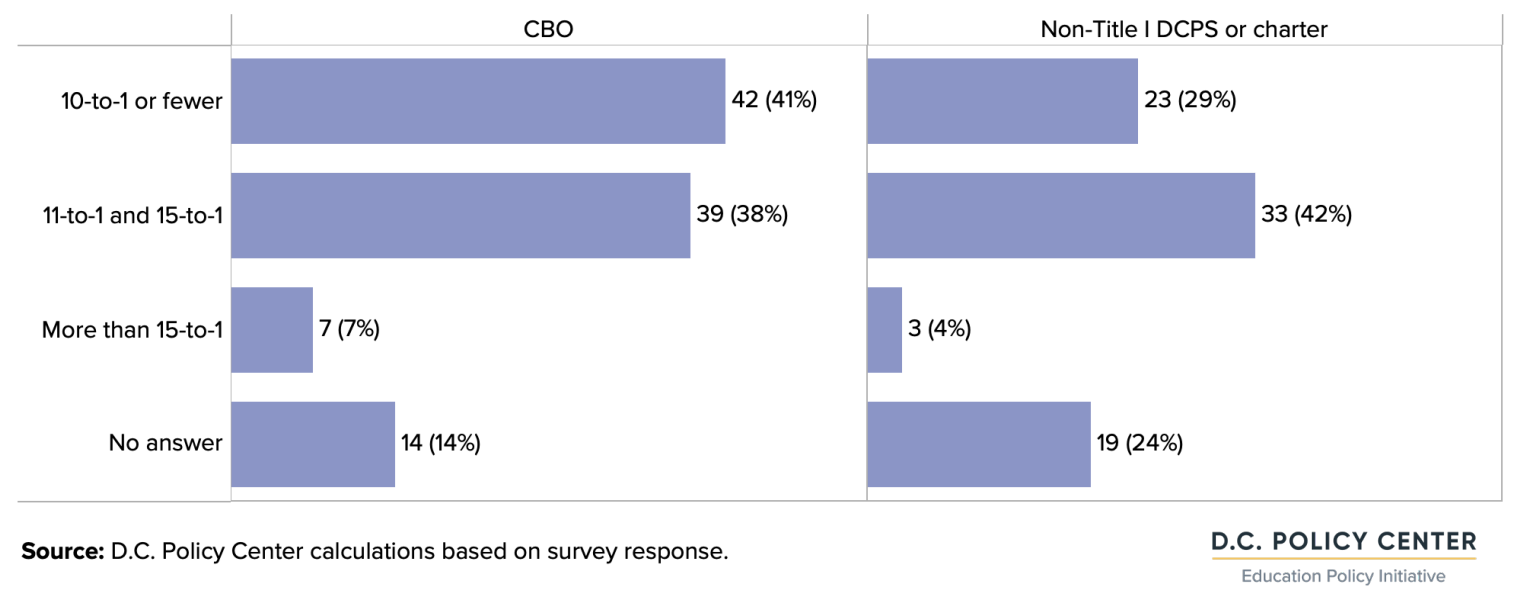
OST providers typically keep participant to staff ratio under 15 to 1.
Only 7 percent of CBOs and 4 percent of non-Title I or charter schools report having staffing models with one staffer for 15 or more participants. CBOs typically have lower class sizes, with 41 percent reporting having one staff for 10 or fewer participants. Among non-Title I and charter schools, this share is 29 percent.
Number and share of providers by their staffing model
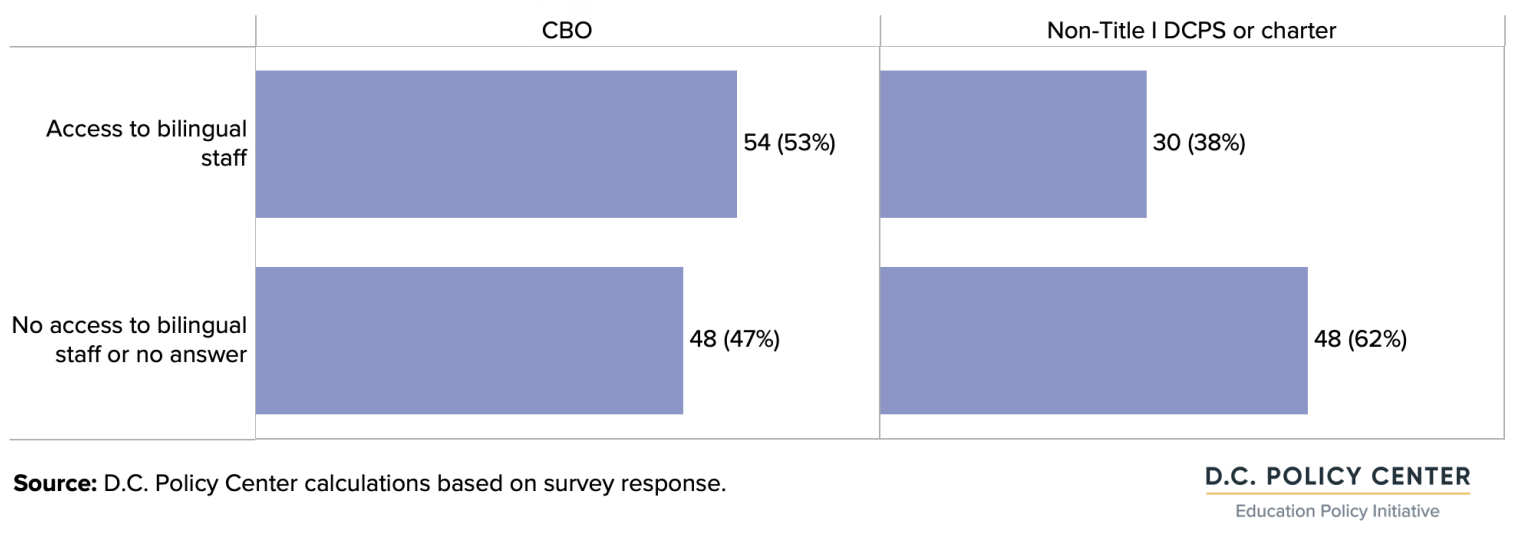
OST programs operated by CBOs are more likely to have bilingual staff than programs run by schools.
53 percent of CBOs that responded to the D.C. Policy Center survey had access to bilingual staff. In contrast this share was 38 percent among OST programs ran by non-Title I or charter schools. It is possible that access to bilingual staff is greater than what is stated in provider responses because a large share of providers do not track this information (14 percent among CBOs and 27 percent among schools.) Additionally, access to bilingual staff is not the same as being able to serve students and families in their native language or providing culturally reflective care.
Number of providers with access to bilingual staff (and share in total providers)
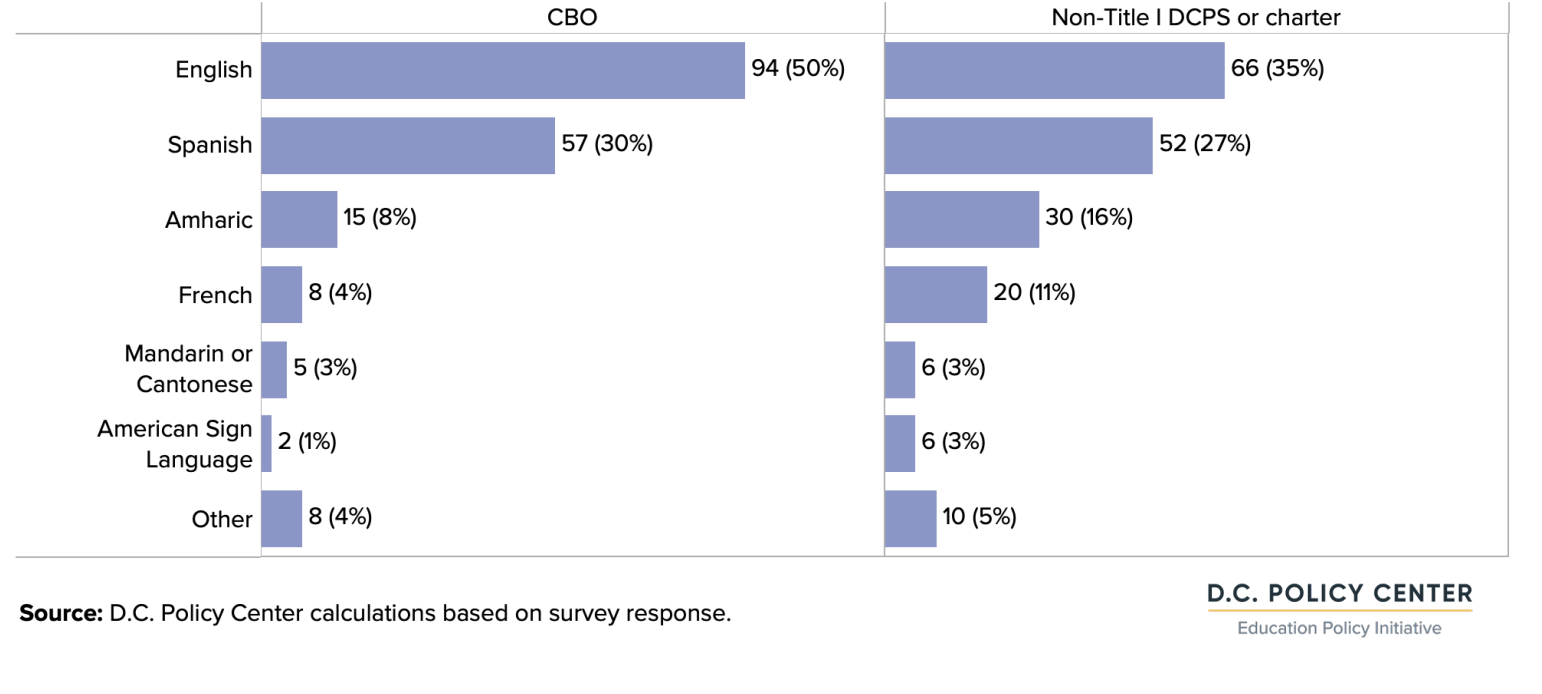
Providers most frequently report Spanish (after English) as the most common language spoken by the children and youth they serve.
56 percent of the CBOs and 67 percent of non-Title I and charter schools report Spanish as one of the languages spoken by the children and youth in their programs. After Spanish, the most frequently mentioned languages are Amharic and French (especially among non-Title I and charter providers), followed by Mandarin and Cantonese.
Number (and share) of providers that report certain languages as spoken by the children and youth they serve
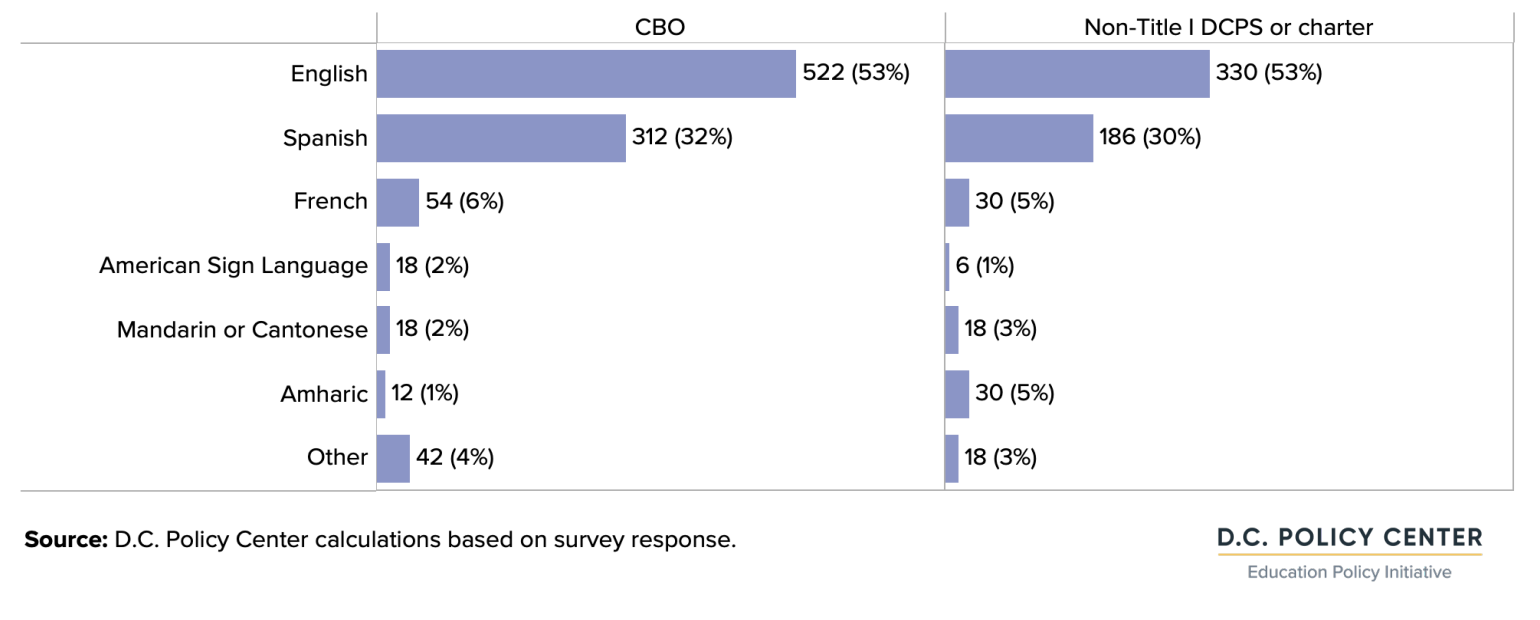
For every language other than English, providers less frequently report access to staff who can speak that language compared to the children and youth.
For example, 56 percent of CBOs and 67 percent of non-Title I schools report serving children and youth speaking Spanish, but only 51 percent of CBOs and 40 percent of non-Title I schools report having access to staff speaking Spanish. Similarly, 39 percent of schools report serving students who speak Amharic, but only 6 percent of schools report having staff who can speak this language. These results are partly driven by fewer providers collecting information on the language skills of their employees. It is possible that more staff can speak different languages, and providers simply do not know this information.
Number (and share) of providers that report certain languages as spoken by their staff
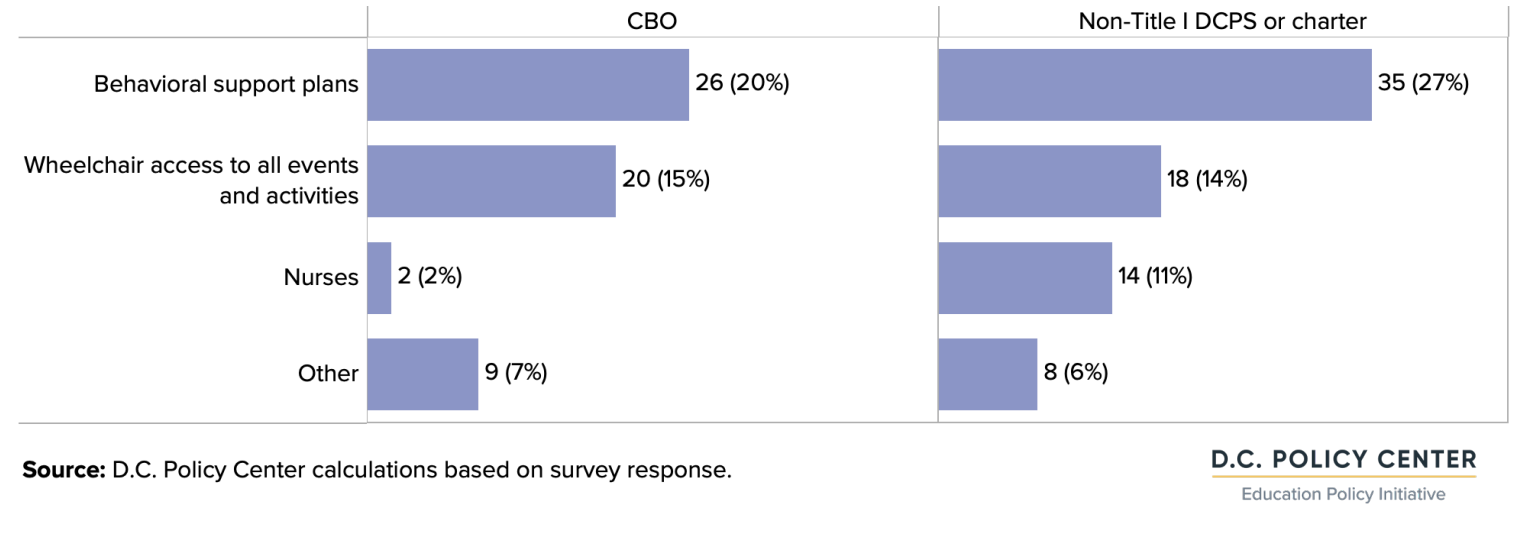
Access to resources that support behavioral services is more common for programs provided by schools.
The most common resource available to students attending OST programs is behavioral support plans. 45 percent of all non-Title I and charter schools and 25 percent of CBOs report using behavioral support plans to support students with disabilities. The second most common resource is wheelchair access to all events and activities to support students with physical disabilities. 20 percent of CBOs and 23 percent of schools report providing this service to their students. Nurses are relatively more common at programs provided by schools since most schools have school-based nurses. Only two CBOs (2 percent of respondents) reported having access to a nurse.
Number (and share) of providers with resources for students with disabilities
Additionally, approximately a quarter of CBOs and 20 percent of non-Title I and charter schools report training their staff on the needs for students with disabilities, such as IEPs and IDEA laws. The majority of providers provide staff training every three months or less frequently. Only about 7 percent of CBOs and 15 percent of non-Title I and charter schools offer training that is monthly or every other month.
PTA involvement is rare in the OST space.
Only 10 CBOs (serving school-based programs) and nine schools reported that PTAs are involved in the OST programing. PTAs, when involved, are most likely to support program delivery and recruitment of students. Involvement of PTAs in financial support of OST programs is rare. Only one CBO and three schools reported that PTAs are actively involved in funding or fundraising for OST programs.
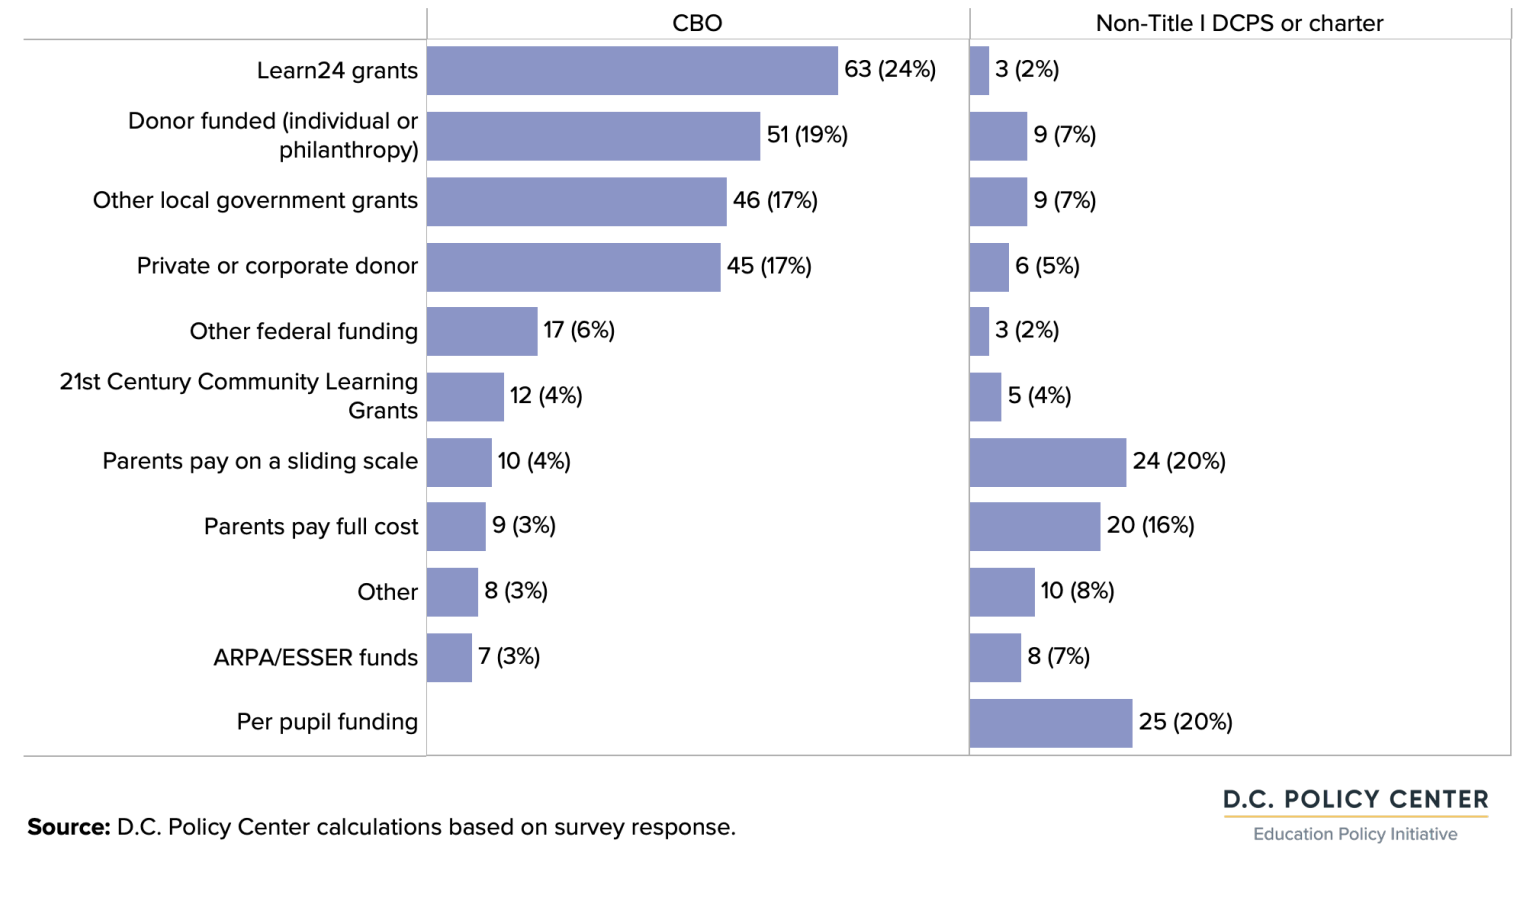
CBOs and non-Title I and charter schools have very different funding streams.
Among CBOs, the largest sources of funding are Learn24 grants (35 percent of CBOs report receiving them), individual or corporate donors (28 percent and 25 percent respectively), and other government grants (26 percent). A small share of CBOs reported charging fees to families either for the full cost of the programs or on a sliding scale. In contrast, the most frequent source of funding for non-Title I and charter schools is the funding they received through the per pupil funding formula (in case of charters) or in their school budgets (in case of DCPS schools). A larger share of programs run by schools charge user fees. Individual or corporate donations are not a significant source of funding for schools.
Number (and share) of providers that report certain funding sources
Issues frequently mentioned by providers
In addition to survey information, the D.C. Policy Center collected additional qualitative information from service providers though open-ended questions and interviews. Providers pointed out the following constraints and bottlenecks that negatively impact their programs.
Staffing
CBOs, public charter schools (and to a lesser extent, non-Title I DCPS schools) most frequently mentioned hiring and retaining qualified staff as a significant challenge that providers face. One main difficulty mentioned by providers in hiring staff is the delay in receiving clearance from the District’s Child Protective Registry. When staff are hired, they must complete a lengthy background check that, recently, has been taking many months to complete. These delays make it difficult for programs to increase capacity to meet increased enrollment, hire staff to help with students with special education needs, and recruit workers. This slow pace of clearance is impacting other D.C. government operations as well. For example, the lack of substitute teachers and paraprofessionals at D.C. Public Schools is often tied to the long and uncertain clearance process.
Many providers mentioned that the conditions of OST jobs were either undesirable for many people, or that wages would need to increase to attract qualified staff. Providers mentioned that wages need to increase for them to attract and retain staff, and that current grant funding is not enough to cover competitive wages. Additionally, providers mention that it is generally difficult to recruit qualified staff for part-time work, and hard to get volunteers, especially due to the extended background clearance processing time.
Funding
When asked about obstacles to expanding programming, the most frequently mentioned issue was funding. Providers frequently mentioned the delays in the timing of grants, instability of grant funding, and the need for additional funds to provide care to special populations. Some providers mentioned that programs had been scheduled to start before they received grant funding, causing delays to program start times. Providers also mentioned that they had difficulty securing grants and that grant funding was not a stable source of income for them.
In addition to the timing and security of grant funding, providers noted that more funding was needed to cover family costs or provide care to special populations. Likely due to circumstances surrounding the Covid-19 pandemic, many families have had reduced capacity to pay for OST programs as they are experiencing economic hardships. This has likely reduced the amount that families can contribute to program costs or pay program fees. Additionally, providers have noted that additional funding may be needed to hire staff to work with students with special needs. Some students need 1:1 care to participate in OST programming, and while there is dedicated funding in schools to provide this care, that funding is not available to OST providers.
Rising costs
Inflation has increased costs for providers, and many services have become more expensive over time. One expense that many providers mentioned was that of insurance. Cyber insurance and other required insurance for OST programs has increased substantially in price, as much as tripling this cost for some providers. Additionally, staff salaries have increased for many providers as staffing has become more difficult, and many providers mentioned difficulties securing leases or working with schools to secure space. Finding and securing consistent space for OST programming was the third most mentioned challenge that providers mentioned.
Enrollment and attendance
Issues with communication and possible changes in priorities for families and students have caused lower enrollments in OST programs than in pre-pandemic years. When the Covid-19 pandemic began, out of school time programs either stopped operations, or shifted to virtual programming. Now that restrictions on in-person programming have been lifted, programs have started in person operations again, lines of communication between programs and families have been broken and many programs have struggled to recruit students and families. Additionally, many providers noted that some students and families, especially those in high school, may have different priorities or competing obligations. For example, in the pandemic many high school students fell behind in their required service hours needed to graduate and are now trying to complete them on a compressed time schedule which conflicts with OST programming. Some other high schoolers took on jobs to earn extra income or help their families. For these reasons and more, while most providers reported increased enrollment from the early Covid-19 pandemic years, most still reported that enrollment was below pre-pandemic numbers.
In addition to reduced enrollment, providers noted that attendance was often unpredictable. Staff members at several schools who work at OST programs reported that schools are also having issues with attendance and engagement, and that in some cases only 40 percent of students are actively attending and engaged. Additionally, exposure to Covid-19 in school and at home can cause students to miss classes and OST programming due to quarantines and sickness. Due to privacy laws, schools cannot share information about sick students to providers.
Participant needs
Since the onset of the Covid-19 pandemic, OST demand has shifted, enrollment and attendance has changed and become less stable from pre-pandemic levels, costs have increased for providers, and student needs have changed. When asked about the needs of students in OST programs, providers frequently mentioned that youth needed additional emotional support, had difficulties managing conflict, needed academic support, and showed learning loss, were facing economic hardship, and needed direct services. Necessary direct services included food, clothing, toys, and transportation.
Detailed information on where D.C. public school students live and go to school, capacity of OST programs and locations, estimated gaps across the city and at the neighborhood level, and the experience of families can be found in the main text of our report.